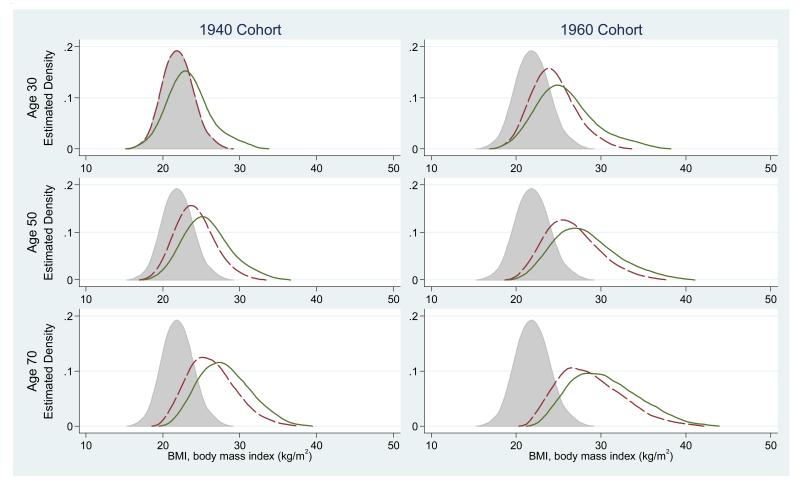
Figure 2.
Quantile regression estimates of the BMI distributions from the model shown in Table 2 in inactive (solid, green curve) and highly active (dashed, red curve) men at ages 30, 50, and 70 in the 1940 cohort and 1960 cohort for men who “eat just what I want,” Dallas, Texas, 1970-2006 (men = 8,885; observations = 17,304). Shaded area in all panels is for reference and represents physically active 30-year-old men in the 1940 cohort.

