
Figure 1. Frequency of risk scores among the study sample.
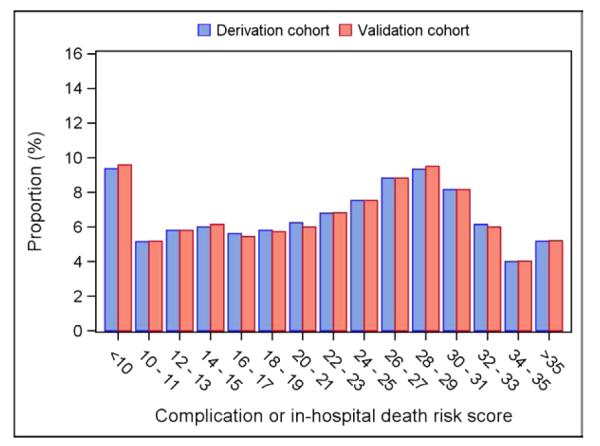
Each patient in the study sample was assigned a numeric score based on a parsimonious risk model that included 12 patient and procedural characteristics that independently predicted procedure-related adverse events. There was a relatively even distribution of scores across a wide range of values.