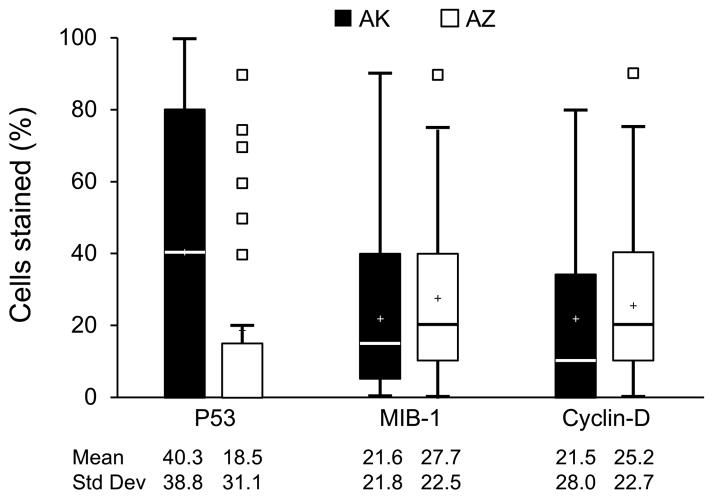
Figure 1.
Boxplots of continuous biomarker values by state. Values represent percent of cells that stained positive for the biomarker of interest. Upper and lower borders of the box represent the 75th and 25th percentiles, respectively. Median and mean values are represented by the blue line inside the box and plus sign, respectively. Whiskers represent the range of values contained within 1.5 times the width of the inter-quartile range above and below the 75th and 25th percentiles. Small boxes represent values lying outside borders of the whiskers.

