
Figure 1.
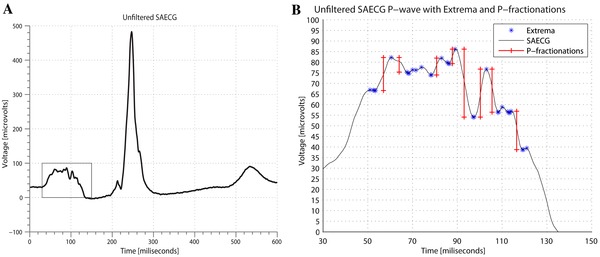
P wave fragmentations measurement. (A) Representative example of SAECG, with the P wave outlined in the rectangle; (B) P wave further zoomed into the rectangular section. All of the local extrema are shown by stars, and the thresholded P fragmentations, are shown by vertical lines.