Figure 3.

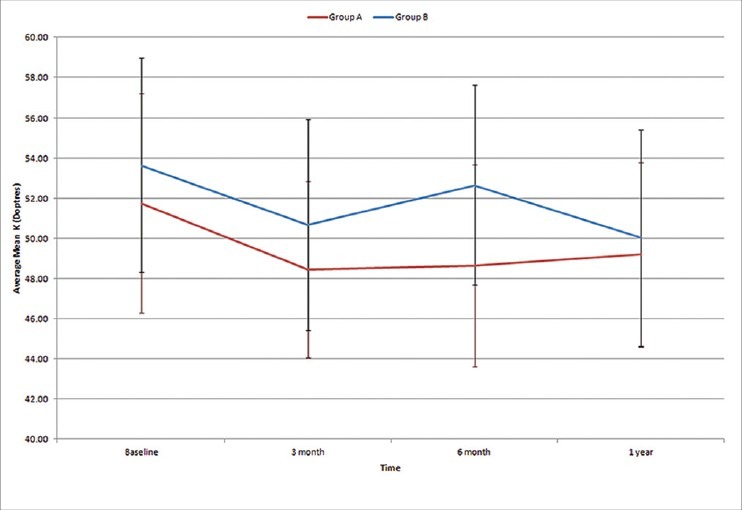
Chart showing improvement in average mean keratometry (Km) in the two groups from preoperative values over 1 year follow-up and the standard deviation at each point

Chart showing improvement in average mean keratometry (Km) in the two groups from preoperative values over 1 year follow-up and the standard deviation at each point