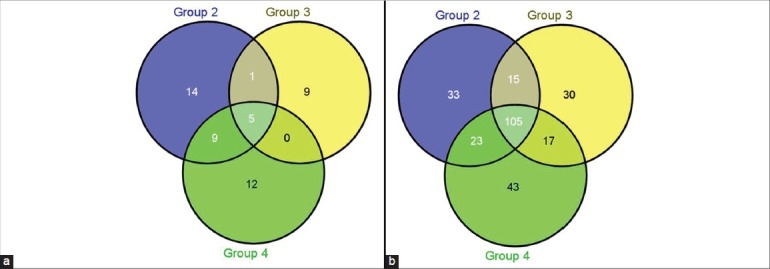
Figure 3.

(a) Depicting number of genes regulated with a 2.5-fold difference across the signaling pathways between treatment nonresponder (Group 4) and treatment responder group (Group 3). Upregulated genes are shown in Figure 2a and downregulated genes are shown in Figure 2b. (b) Depicting number of genes regulated with a 2.5-fold difference across the signaling pathways between treatment nonresponder (Group 4) and treatment responder group (Group 3). Upregulated genes are shown in Figure 2a and downregulated genes are shown in Figure 2b
