
Figure 2.
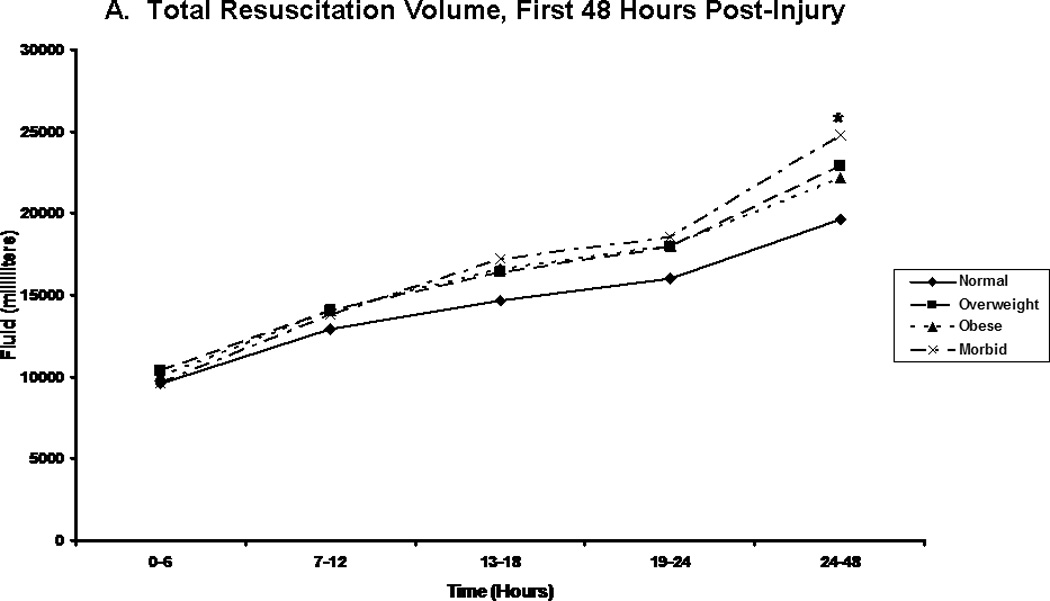
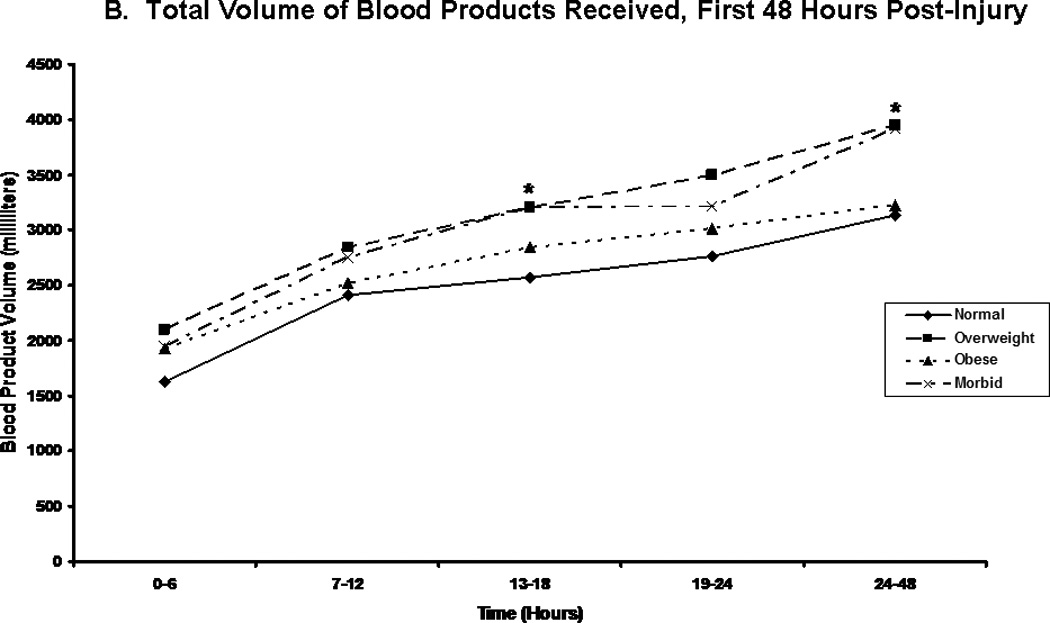
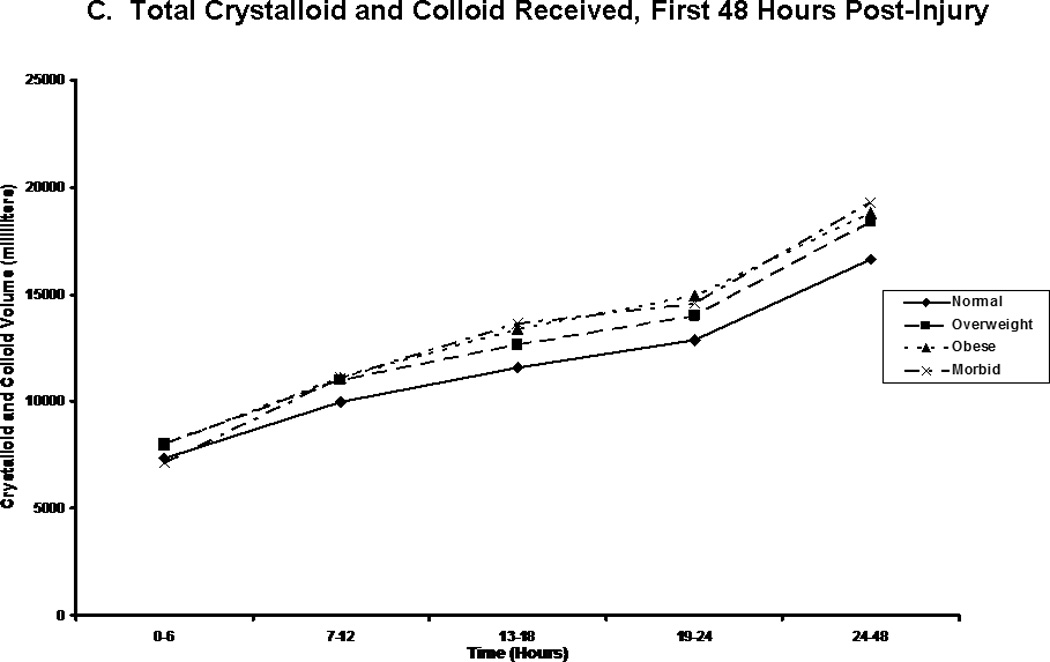
Post-injury fluid resuscitation volumes. Panel A depicts the total fluid volume received by patients in each body mass index classification over time during the first 48 hours following injury. Panel B depicts the total blood volume received by patients in each body mass index classification. Panel C depicts the total crystalloid volume received by patients in each body mass index classification. Values presented are medians. * indicates significantly greater volume received than normal weight patients at the specified time point.