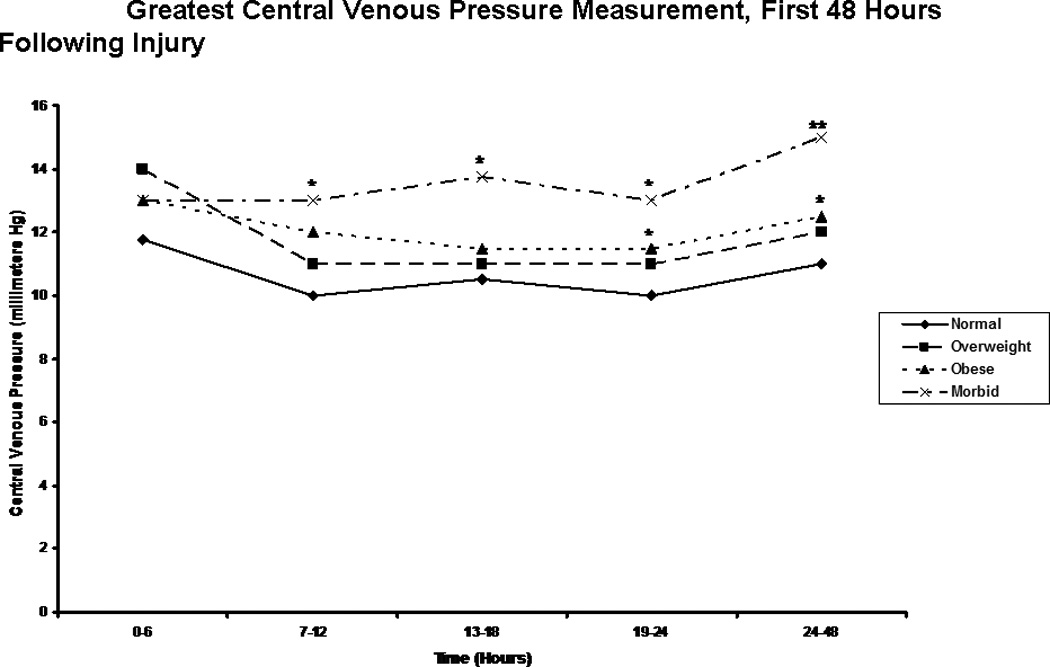
Figure 4.

Central Venous Pressure readings. The figure depicts the median greatest central venous pressure measurements for patients in each body mass index classification during the first 48 hours following injury. * indicates a significantly greater central venous pressure reading than normal weight patients at the specified time point. ** indicates a significantly greater central venous pressure reading than normal weight and overweight patients at the specified time point.
