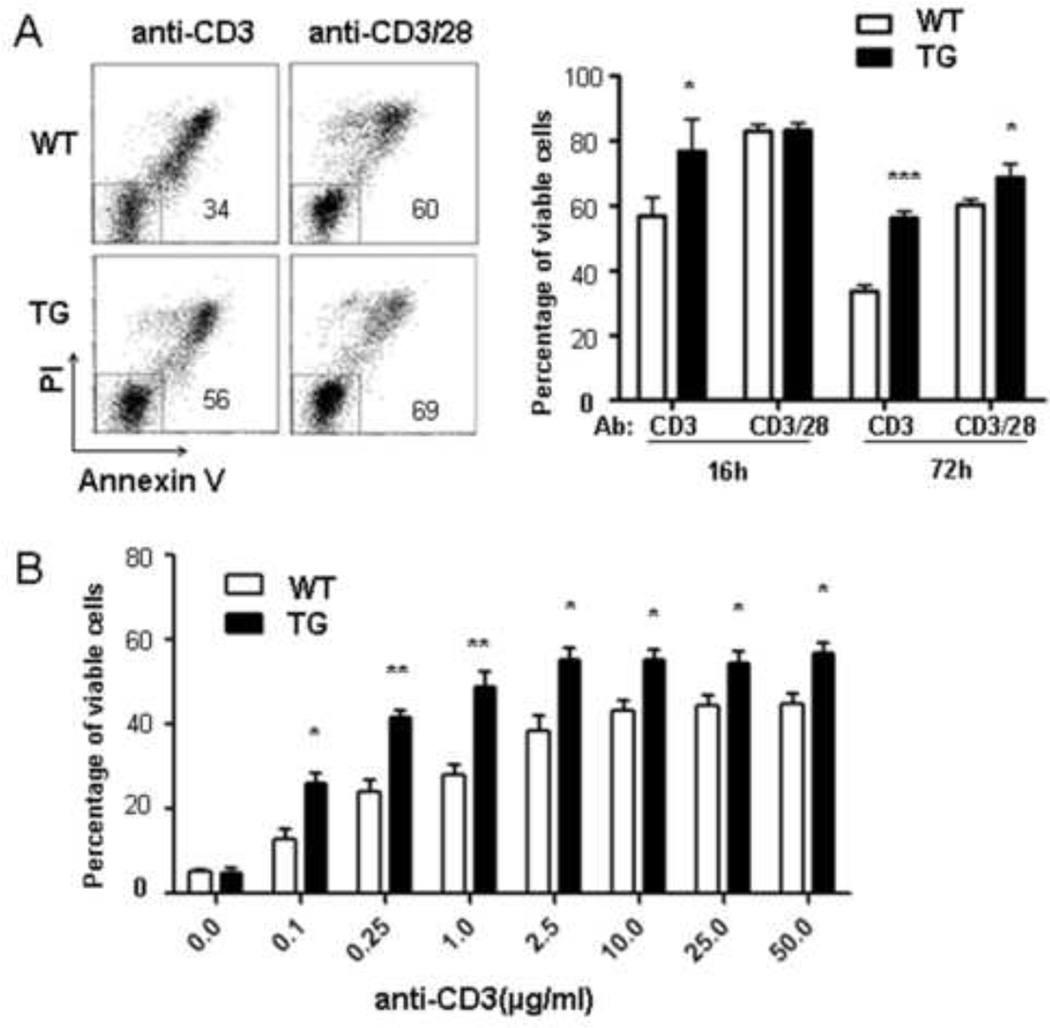
Fig 2. Id1 expression enhances survival of anti-CD3-activated T cells.
(A) Naïve CD4+ T cells from WT or TG mice were stimulated as in Fig. 1A and analyzed by PI and Annexin V staining. Representative dot plots after culturing for 72 hours are shown. The number in the plot indicates the percentage of PI−Annexin V− live cells. Results from four independent experiments obtained after culturing for 16 and 72 hours are summarized as mean±SD. (B) T cells survival was analyzed 72 hours after stimulation with different concentrations of anti-CD3. Data shown are from four independent experiments statistical analyses were done by comparing WT to TG cells. *p<0.05; **p<0.01; ***p<0.001.

