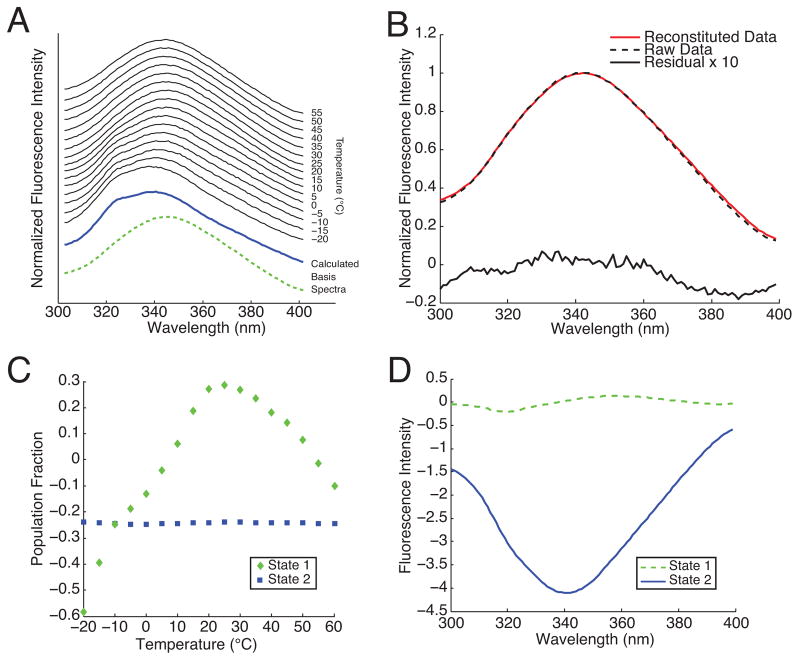
FIG. 1.
(A) Fluorescence emission of cytochrome c protein excited at 200 nm as a function of temperature. Each individual spectrum has been normalized to its peak intensity. The calculated basis spectra were generated using the new technique presented here. (B) Example reconstituted data (shown for 35 °C) using the first two singular values. (C) Population VT corresponding to each basis function obtained from SVD. (D) Basis spectra U obtained from SVD. Neither the populations in (C) nor the spectra in (D) have a straightforward physical interpretation.

