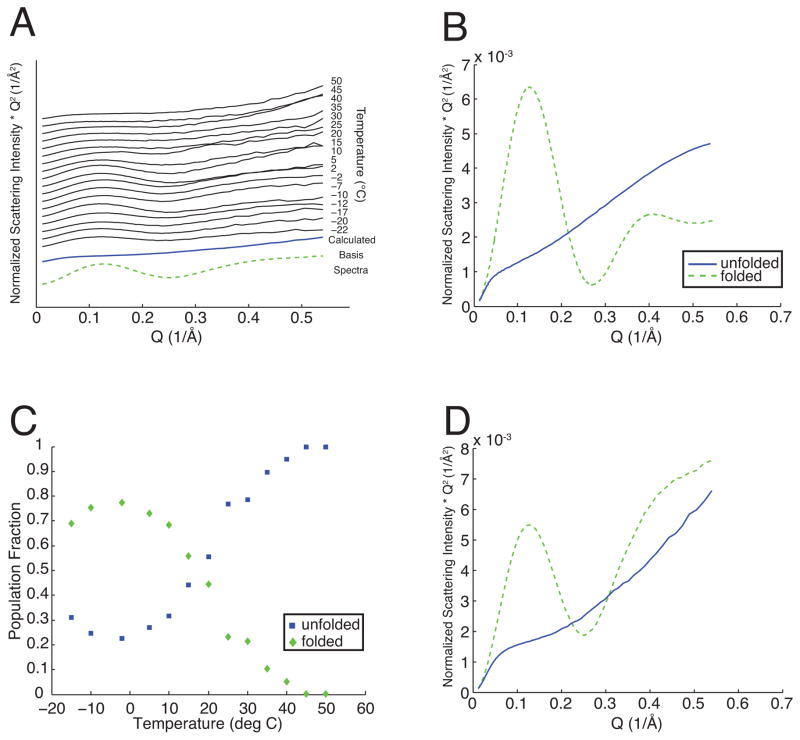
FIG. 3.
Constrained two-state decomposition of SAXS data (A) from the same protein samples as in Fig. 2 into normalized populations (C) and normalized basis spectra (D). Theoretical basis spectra corresponding to folded (dashed line) and unfolded (solid line) states are shown for comparison in (B).

