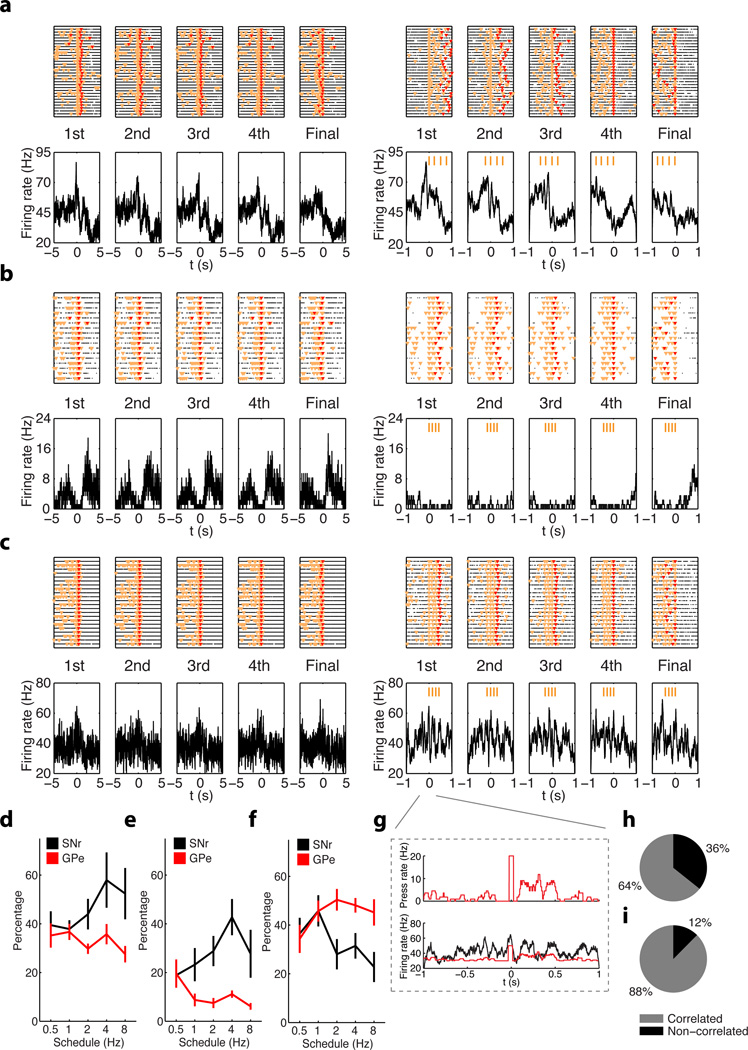
Figure 3. Neuronal activity in the SNr and GPe during learning and performance of rapid action sequences.
a, A SNr neuron shows phasic firing rate increase selectively before the first lever press of each action sequence. b, A SNr neuron shows inhibited firing activity throughout the whole action sequence. c, A GPe neuron displays sustained firing activity throughout the whole action sequence. d–f, Percentage of SNr (black) and GPe (red) neurons showing start/stop (d), inhibited (e) or sustained (f) sequence-related activity during the performance of action sequences under different schedules. h, The lever press histogram (top panel) and the sustained GPe neuron PETH (bottom panel) both aligned to the first lever press within action sequences. i, j, Percentage of neurons in SNr (i) and GPe (j) displaying sequence-related sustained activity with significant correlation between PETH and average lever press rate.

