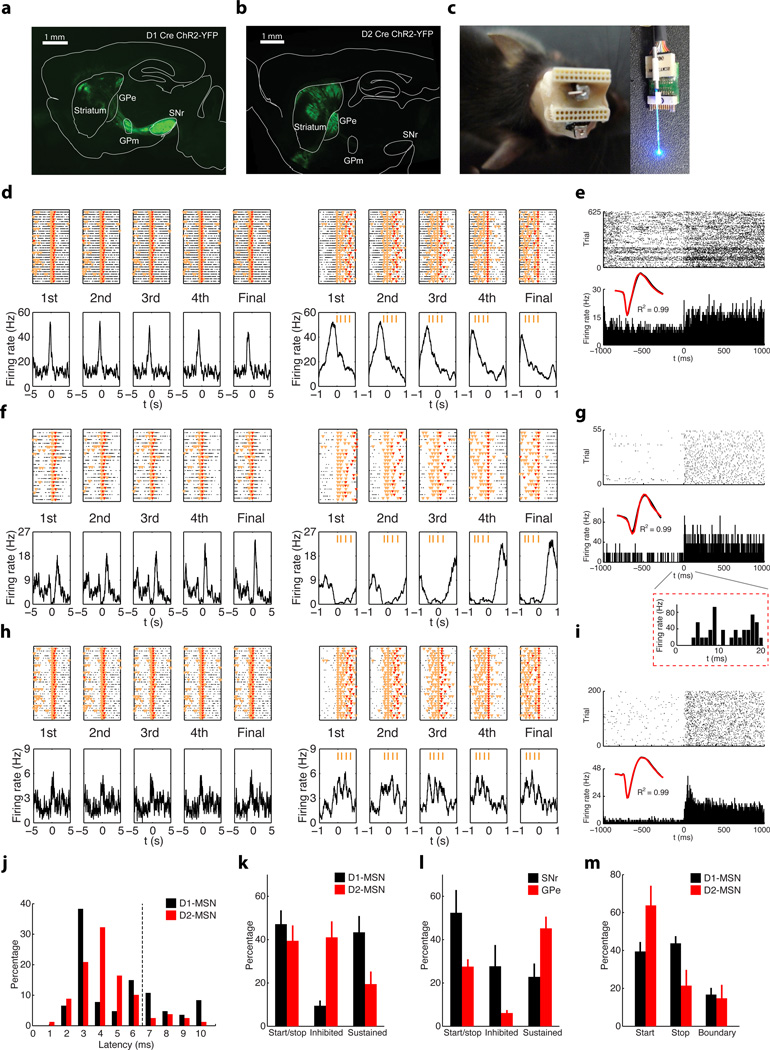
Figure 5. Subcircuit-specific neuronal activity in the basal ganglia during learning and performance of rapid action sequences.
a, A coronal section of dorsal striatum from a D1 Cre mouse with viral driven expression of ChR2-YFP; note axons targeting GPm and SNr. Scale bar 1mm. b, A coronal section of dorsal striatum from a D2 Cre mouse with viral driven expression of ChR2-YFP; note axons targeting GPe. Scale bar 1mm. c, Illustration of electrode array and cannula design allowing for adjustable fiber optic stimulation for cell identification. d, PETH of a MSN recorded in a D1-ChR2 mouse, showing sequence start related activity. e, Same neuron as (d) evident by identical waveform (black trace during action sequences vs. red trace during light stimulations, same for below) showed reliable, short-latency response to blue light stimulation. f, PETH of a MSN recorded in a D2-ChR2 mouse, showing sequence-related inhibited activity. g, Same neuron as (f) shows reliable, short-latency response to blue light stimulation at the end of session. Inset panel showing the neuronal response to light stimulation at fine time scale. h, i, PETH of a MSN recorded in a D1-ChR2 mouse, showing sequence-related sustained activity (h), and its response to light stimulation at the end of the session (i). j, Distribution of light to response latencies for D1- and D2-MSNs. k, l, Proportions of striatal D1-and D2-MSNs (k), and SNr and GPe neurons (l) displaying different types of sequence-related activity under FR4/0.5s. m, Percentage of striatal D1- or D2-MSNs displaying sequence start, stop, or boundary-related activity.

