
Fig. 1.
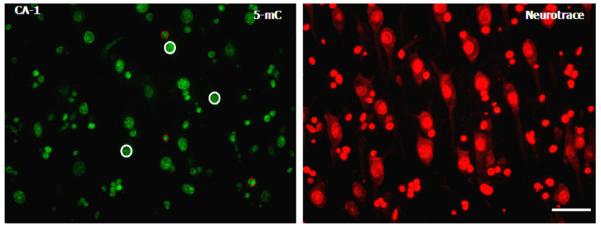
Hippocampal 5-methylcytidine (5-mC) immunoreactivity (IR) and Neurotrace counterstain. Representative photomicrograph of 5-mC IR (green) and the corresponding Neurotrace image (red) taken from the CA1 hippocampal subregion. Based on the Neurotrace morphology, a total of 15 neurons and 15 glial cells were delineated within each photomicrograph, and their fluorescence intensity was analyzed using ImageJ software (details in text). Representative neurons are highlighted with a continuous white circle, whereas glial cells are highlighted with a dotted red circle. A total of 15 images per subject for each staining concomitant with 15 corresponding Neutrorace-counterstained images were analyzed. Scale bar = 50 μm.