
Fig. 3.
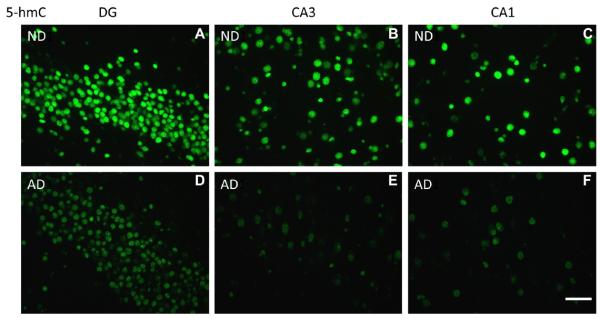
Representative photomicrographs of 5-hydroxymethylcytosine (5-hmC) immunoreactivity (IR). High magnification representative photomicrographs of the hippocampal DG, CA3, and CA1-2 regions. (A–C) Non-demented control cases (ND) and (D–F) Alzheimer’s disease cases (AD). Note: A decrease of 5-hmC IR is observed in AD cases when compared to ND controls in all 3 hippocampal subregions. Images were taken with a ×40 objective. Scale bar = 50 μm.