
Fig. 7.
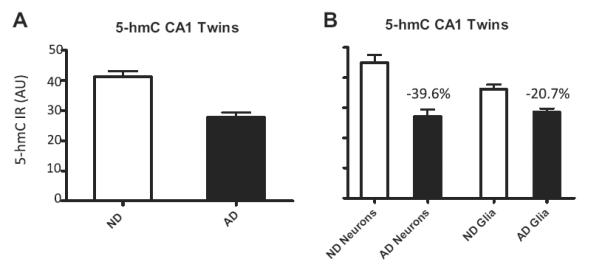
Hippocampal 5-hmC fluorescence intensities in the monozygotic twin pair discordant for Alzheimer’s disease cases (AD). Mean and standard error of the mean of fluorescence intensity measurements of 5-hmC immunoreactivity (IR) (A and B). Pooled data (A) and stratified data from neurons and glial cells (B) from the non-demented control case (ND; open bars) and Alzheimer’s disease case (twin) (AD; filled bars) are represented for the CA1 hippocampal subregion. Percentages of decrease in each analysis are indicated in each graph. Abbreviation: AU, arbitrary units.