
Fig. 3.
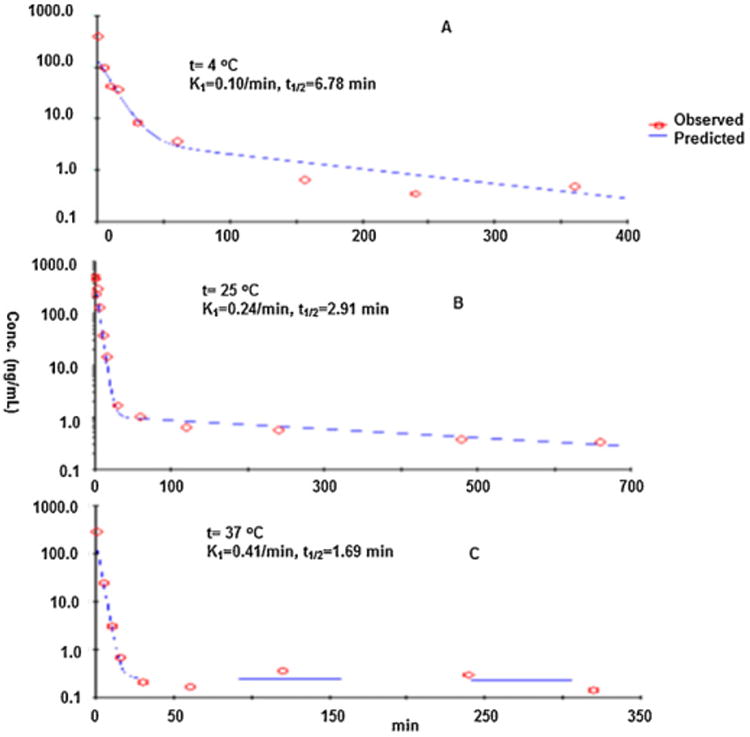
The stability of kisspeptin-10 in rat plasma at different temperatures: decomposition curve of kisspeptin-10 at 4 °C (A), 25 °C (B) and 37 °C (C). The y-axis is the ratio of the peak area of kisspeptin-10 relative to SP. The x-axis is the incubation time in rat plasma.