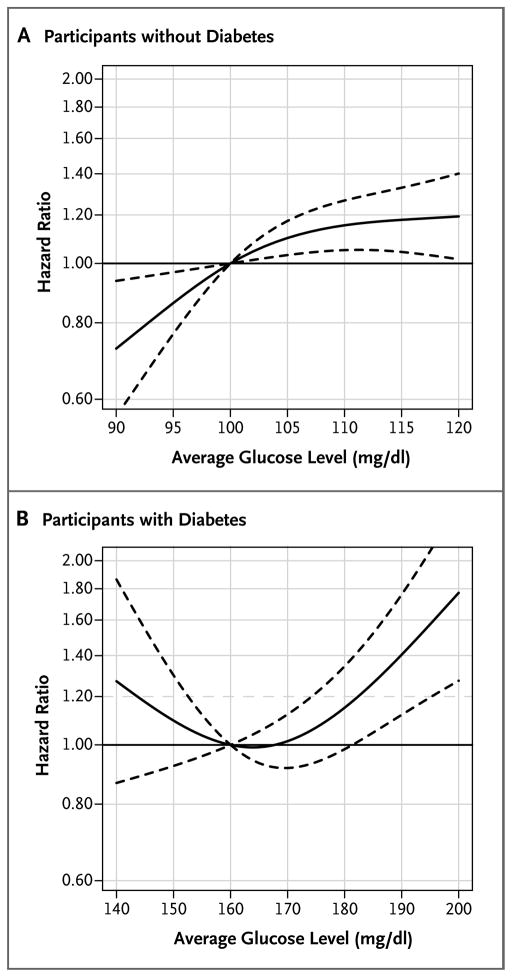
Figure 1. Risk of Incident Dementia Associated with the Average Glucose Level during the Preceding 5 Years, According to the Presence or Absence of Diabetes.
Solid curves represent estimates of the hazard ratios for the risk of incident dementia across average glucose levels relative to a reference level of 100 mg per deciliter for participants without diabetes (Panel A) and 160 mg per deciliter for participants with diabetes (Panel B). The dashed lines represent pointwise 95% confidence intervals. To convert the values for glucose to millimoles per liter, multiply by 0.05551.

