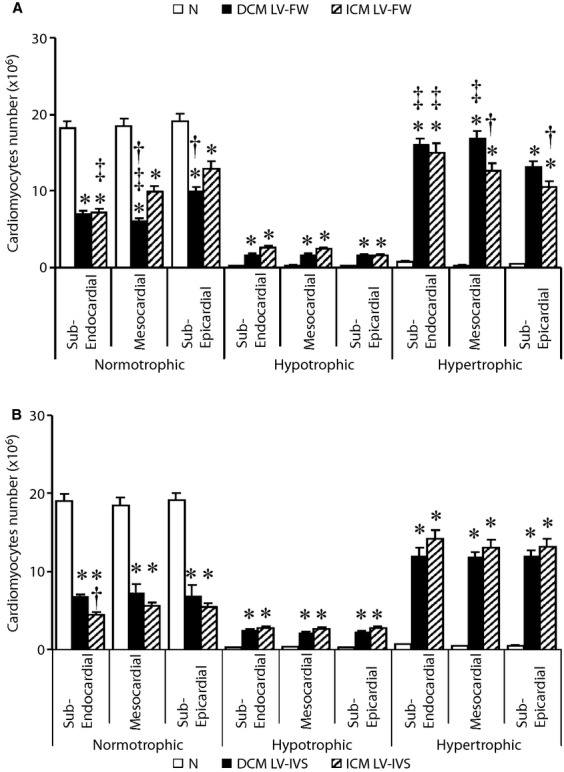
Figure 4.

Regional quantification of normo-, hypo-and hyper-trophic cardiomyocytes in each myocardial layer of left ventricle-free wall (LV-FW; A) and inter-ventricular septum (IVS; B) of N (n = 8), dilated cardiomyopathy (DCM;n = 11) and ischaemic cardiomyopathy (ICM;n = 12) hearts. Values are means ± SEM. *P < 0.05 versus Normal, †P < 0.05 versus corresponding layer of ICM heart, ‡P < 0.05 versus sub-epicardial layer/sub-endocardial right ventricle (RV) layer.
