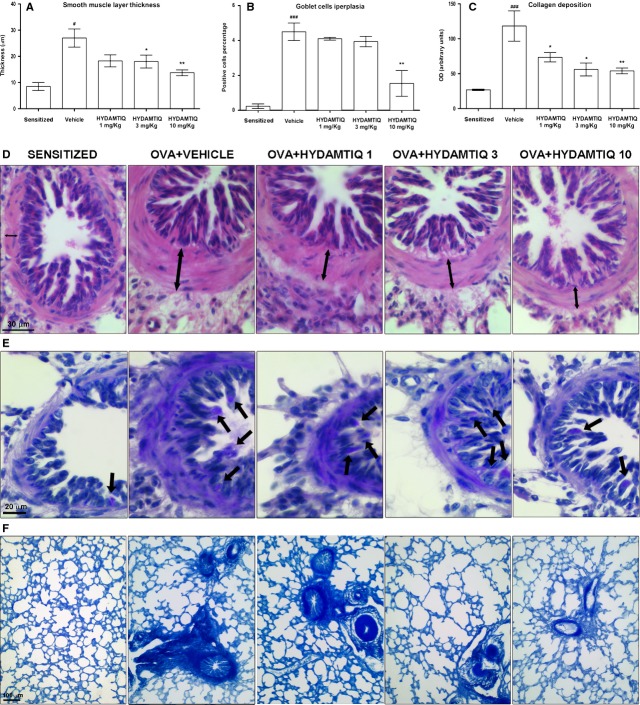
Figure 4.
Histopathological evaluation of airway remodelling. (A and D) Smooth muscle layer thickness (see the arrows). (B and E) Goblet cells in PAS-stained lung sections (see the arrows). (C and F) Densitometric analysis of collagen deposition in Azan-stained lung sections. Data are means ± SEM. #P < 0.05 and ###P < 0.001 versus Sensitized; *P < 0.05 and **P < 0.01 versus Vehicle.

