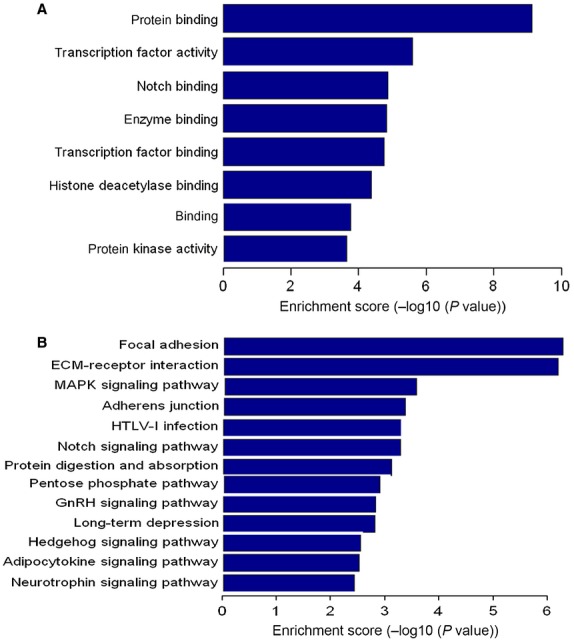
Figure 4.

GO and KEGG pathway analysis of the deregulated miRNAs. Enrichment score is equal to −log10 (P-value). The higher the enrichment score is, the more specific the corresponding function is. (A) significant GOs. (B) significant signalling pathways. KEGG: Kyoto Encyclopedia of Genes and Genomes; GO: Gene ontology. BH-corrected P < 0.05 was considered statistically significant.
