
Figure 5.
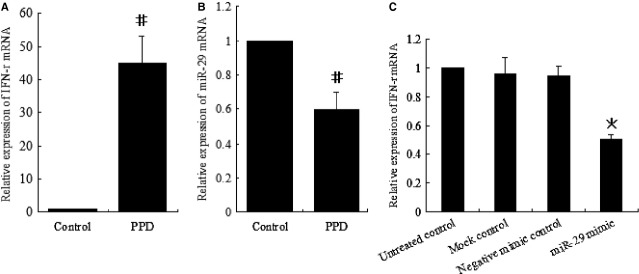
Correlation between miR-29 expression and interferon-γ (IFN-γ) level in CD4+ T cells in vitro. (A and B) RT-qPCR analysis of IFN-γ (A) and miR-29 mRNA (B) in CD4+ T cells left unstimulated (control) or stimulated with PPD for 24 hrs. (C) RT-qPCR analysis of IFN-γ mRNA in CD4+ T cells transfected with miR-29 mimics or control mimics. #Significant difference between the control and PPD. *Significant difference between miR-29 mimics and the controls. P < 0.05 was considered statistically significant. Error bars in graphs referred to standard deviation. All experiments were repeated at least three times.