Fig. 2.
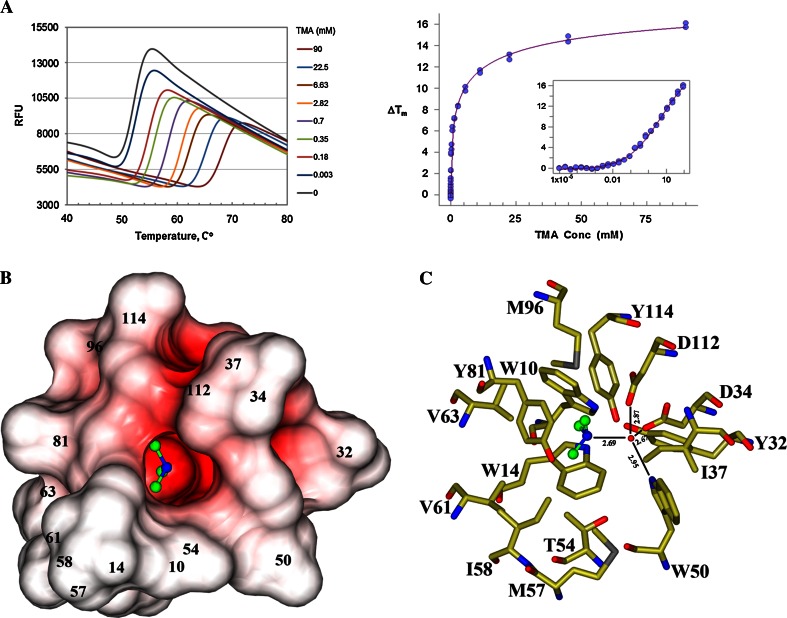
Fluorescent thermal shift analysis and TMA binding site. a Melting curves of Caci_0382 versus TMA concentration (left) and plots of ΔTm versus TMA concentration (right). The TMA concentration of the inset is in log scale. The protein has a very steep unfolding transition. Specific binding of TMA is indicated by the significant transition temperature shift, which is 3 °C at 0.1 mM TMA. After an initial sharp rise, increasing TMA concentration shifts the transition progressively at a slower rate. However the plateau was never reached at the concentrations tested, suggesting multi-site binding of TMA with different affinities. b Electrostatic surface of the TMA (ball-and-stick model) binding pocket. The surface was created by program CCP4MG [19] and colored by surface potential charge scaled from negative in red (−0.5 V) to positive in blue (+0.5 V); c position of the TMA in the active site. Carbon and nitrogen atoms of the TMA colored in green and blue, respectively. In the model oxygen atoms of the surrounding residues are colored in red, nitrogen in blue, carbon in gold and sulfur in grey. H-bonds are shown as lines

