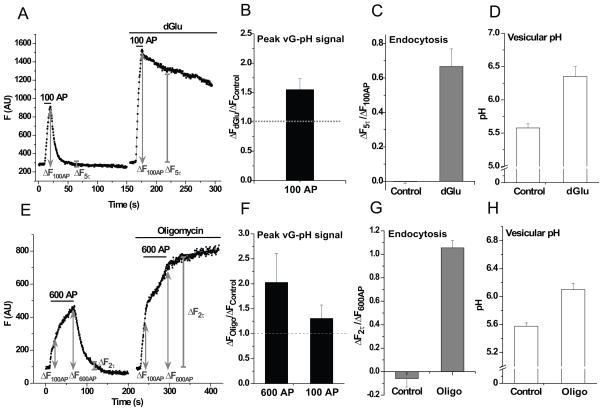
Figure 5. Presynaptic function relies on activity-driven ATP synthesis.
Sample vGlut-pHluorin (vG-pH) traces showing (A) 100 AP responses before and after 5 min incubation in dGlu and (E) 600 AP responses before and after 5 min incubation in Oligo. Average ratio of the stimulus response in (B) dGlu compared to control (ΔFdGlu/ΔFcontrol) at 100 AP (n = 9) and (F) Oligo compared to control (ΔFOligo/ΔFcontrol) at 600 and 100 AP (n = 4). Average endocytic block measured as the fraction of vG-pH fluorescence remaining at (C) 5 endocytic time constants (5τ) of the control at the end of 100 AP in control and dGlu (ΔF5τ/ΔF100AP), n = 9 and (G) at 2 endocytic time constants (2τ) at the end of 600 AP in control and Oligo (ΔF2τ/ΔF600AP), n = 4. Average vesicular pH determined from the vG-pH responses to NH4Cl and acid quenching in (D) dGlu (n = 6) and (H) Oligo (n = 4). Error bars are SEM. See also Figure S5.

