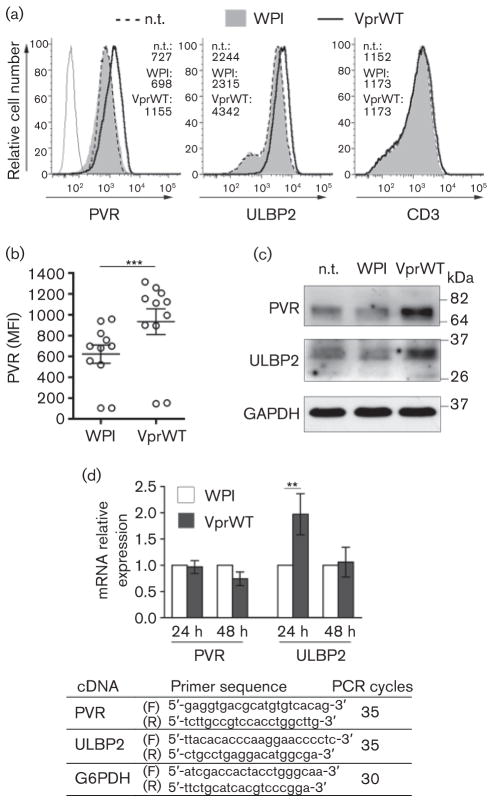
Fig. 1.
HIV-1 Vpr upregulates PVR acting at a post-transcriptional level. (a–c) Jurkat T cells were transduced with 0.3 m.o.i. of WPI or VprWT lentivirus or not transduced (n.t.) and analysed 48 h later. (a) Histograms show the fluorescence distribution of cells labelled with mAbs against PVR (SKII.4) or ULBP2 (MAB165903; R&D System) and Alexa647-conjugated goat anti-mouse IgG (GAM) (Invitrogen) or with anti-CD3 APC-conjugated mAb (EuroBioSciences) analysed by flow cytometry with a FACSCanto (BD Bioscience). The mean fluorescence intensity (MFI) values are indicated. Dashed line, filled grey histogram, and solid line represent n.t. cells, WPI- and VprWT-transduced cells, respectively. Upon staining with isotype control mAb the three cell samples were identical, so only WPI-transduced cells stained with control IgG are shown (grey line). (b) Scatter dot plot shows the MFI of PVR expression in Jurkat cells transduced with WPI or VprWT lentivirus in 11 independent experiments; mean±SEM are also indicated. ***, P≤0.001 by Wilcoxon signed rank test. (c) Equal amounts of total cell lysates (30 μg) were separated by 10 % SDS-PAGE in non-reducing conditions, then analysed by standard immunoblotting using anti-PVR (5D1), anti-ULBP2 (AF1298; R&D Systems) and anti-GAPDH (MAB374, Millipore) antibodies. Molecular mass standards are indicated (kDa). One out of three independent experiments is shown. (d) RT-PCR was used to assess PVR and ULBP2 mRNA expression normalized to G6PDH mRNA at 24 h and 48 h after transduction of Jurkat cells with WPI or VprWT. Relative mRNA expression in VprWT-transduced cells (filled bar) compared with WPI-transduced cells (open bar) is shown. Error bars are ±SEM. Results shown are representative of three independent experiments. **, P≤0.01 by Wilcoxon signed rank test. Forward (F) and reverse (R) primer sequences and number of PCR cycles used for each cDNA are shown.

