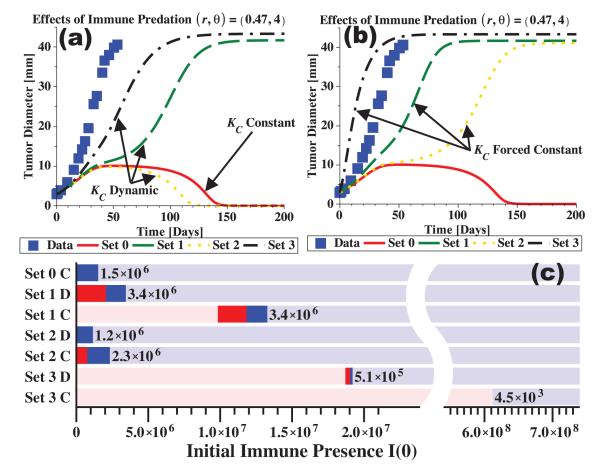
Figure 4.
Immunotherapy treatment is simulated by an increased immune recruitment rate, r, and an increased predation efficacy, θ. Treatment is given at the time of tumor detection (here t=0) and is assumed to be immediately effective with no decay. Any immune presence at detection is ignored (I(0)=0). In (a, b) the data points show the growth trend with no immune interaction (as in Figure 3). The dynamic carrying capacity model with parameter sets 1, 2, and 3 are shown in (a) along with the constant capacity model with parameter set 0. In (b), the dynamic capacity models are forced to have constant capacities, disrupting the regulatory signal to the tumor. All curves are modified to different extents by immune predation when compared to the data (no predation). In (c), tumor fate is indicated for increasing initial immune presence, I(0). From left to right, the pink regions represent tumor escape with no dormancy, the red regions represent tumor escape after dormancy, the blue regions represent tumor elimination after dormancy, and the light blue regions represent tumor elimination with no dormancy. Dormancy is defined as a period of non-growth lasting at least 30 days. The width of each dormancy range (red plus blue region) is labeled to the right of each range. Parameter sets 1, 2, and 3 are used with the dynamic capacity (D) and constant capacity (C) models. Parameter values are r=0.47 and θ=4 together with the values from Tables 1 and 2.

