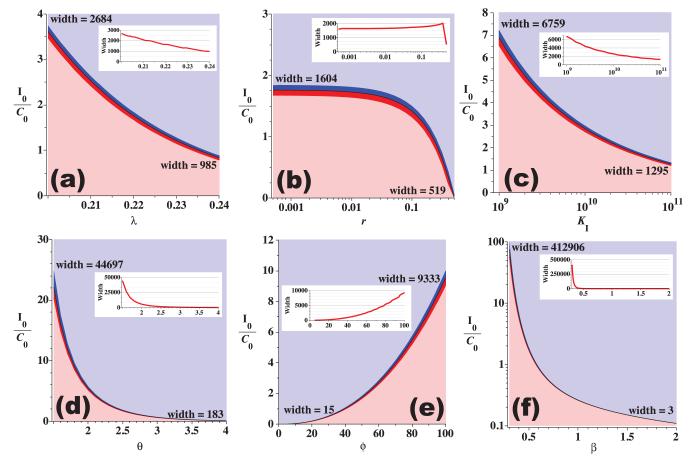
Figure 5.
Parameter sensitivity for immune system parameters (λ (a), r (b), KI (c), θ (d), ϕ (e), and β (f)) using the model with constant carrying capacities and parameter values from Table 1 (set 0). The lower (pink) regions indicate tumor escape, the upper (light blue) regions indicate tumor elimination, and the mid-regions indicate that the tumor either escaped (red) or was eliminated (blue) after a period of at least 30 days of dormancy. Vertical axes indicate the initial immune presence relative to the initial cancer presence. Theoretically, tumor dormancy should be easier for the immune response to achieve when the required initial presence I0 is small and the width of the dormancy region (red and blue middle regions) is large. The width of the dormancy regions (measured in initial immune presence) is indicated at the left and right endpoints of the curves as well as on the inset line graphs.

