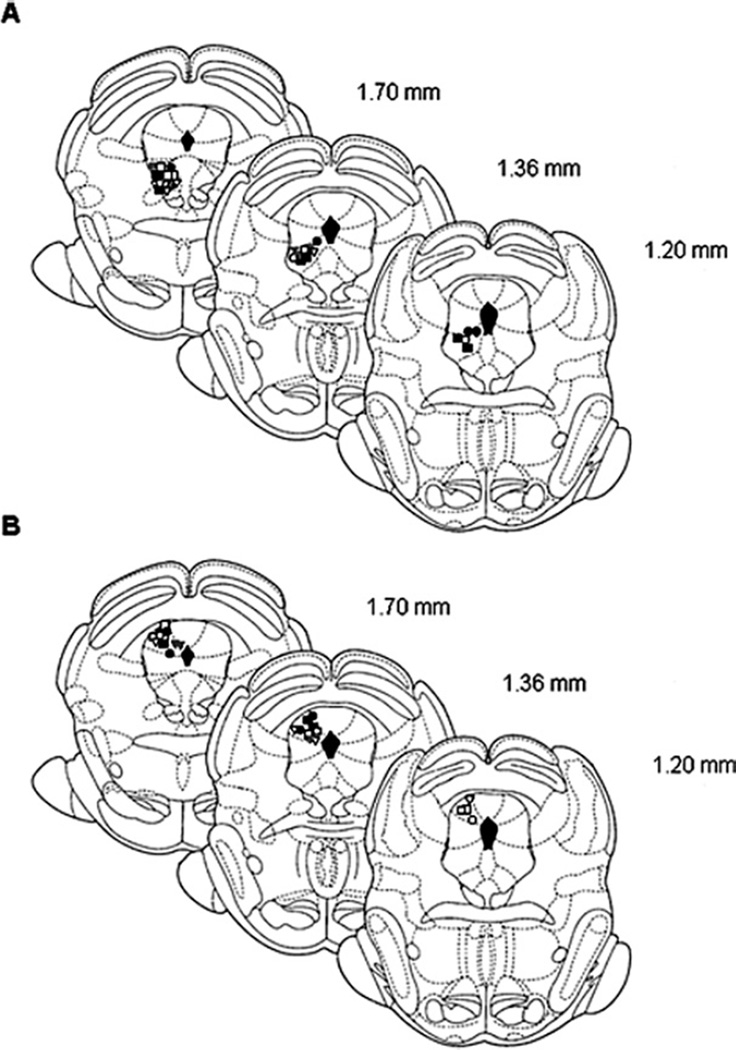
Fig. 3.
Schematic coronal sections of the rat brain adapted from Paxinos and Watson (2005) illustrating approximate sites of microinjections into the vlPAG (A) and dlPAG (B). Numbers indicate that distance from the interaural in millimeters. Only rats with injection sites in or immediately adjacent to the vlPAG or dlPAG were included in data analysis. Symbols represent the microinjection sites; filled symbols indicate animals microinjected with CoCl2 and open symbols, vehicle. Animals were stimulated with high frequency TENS (squares), low frequency TENS (circles) or sham TENS (triangles).

