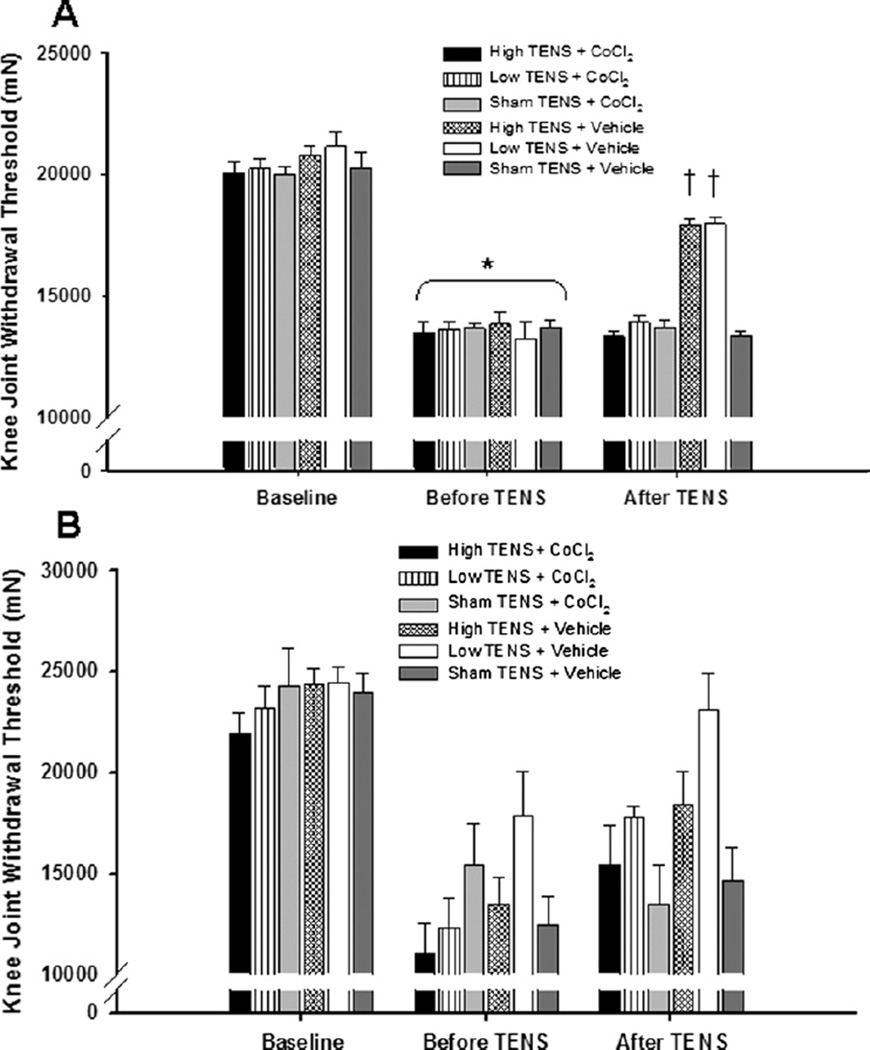
Fig. 5.
Bar graph representing mechanical withdrawal threshold of the knee from animals microinjected with either CoCl2 or vehicle into the (A) vlPAG or (B) dlPAG. Mechanical withdrawal thresholds are illustrated prior to induction of inflammation (Baseline), before application of TENS, and after microinjection of the vlPAG or dlPAG. Data are represented as mean±SEM. P value <0.05 was considered statistically significant. * Significantly different from baseline time; † significantly different from vehicle control groups.

