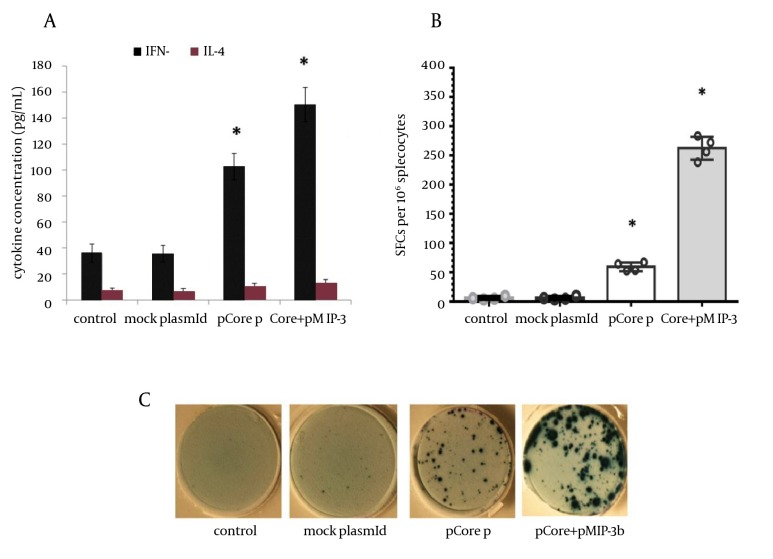
Figure 3. Cytokine ELISA and ELISpot Assay.
A) Supernatant of cultured splenocytes was collected after 72h of recall by core protein/peptide cocktail and was assessed for IFN-gamma and IL-4 by using ELISA. Data were representative of mean cytokine concentration (pg/mL) ± SD of four mice per group in triplicate. B) IFN-gamma ELISpot was performed to identify the relative population of core specific IFN-gamma producing cells. The circles represent average of SFCs /106 splenocytes in triplicate assays for each mouse (n=4 mice per group), while error bars indicate SD. Asterisks indicate the significant difference among labeled groups and/or the control groups. C) Representative images of ELISpot wells of each experimental group (antigen-stimulated wells).

