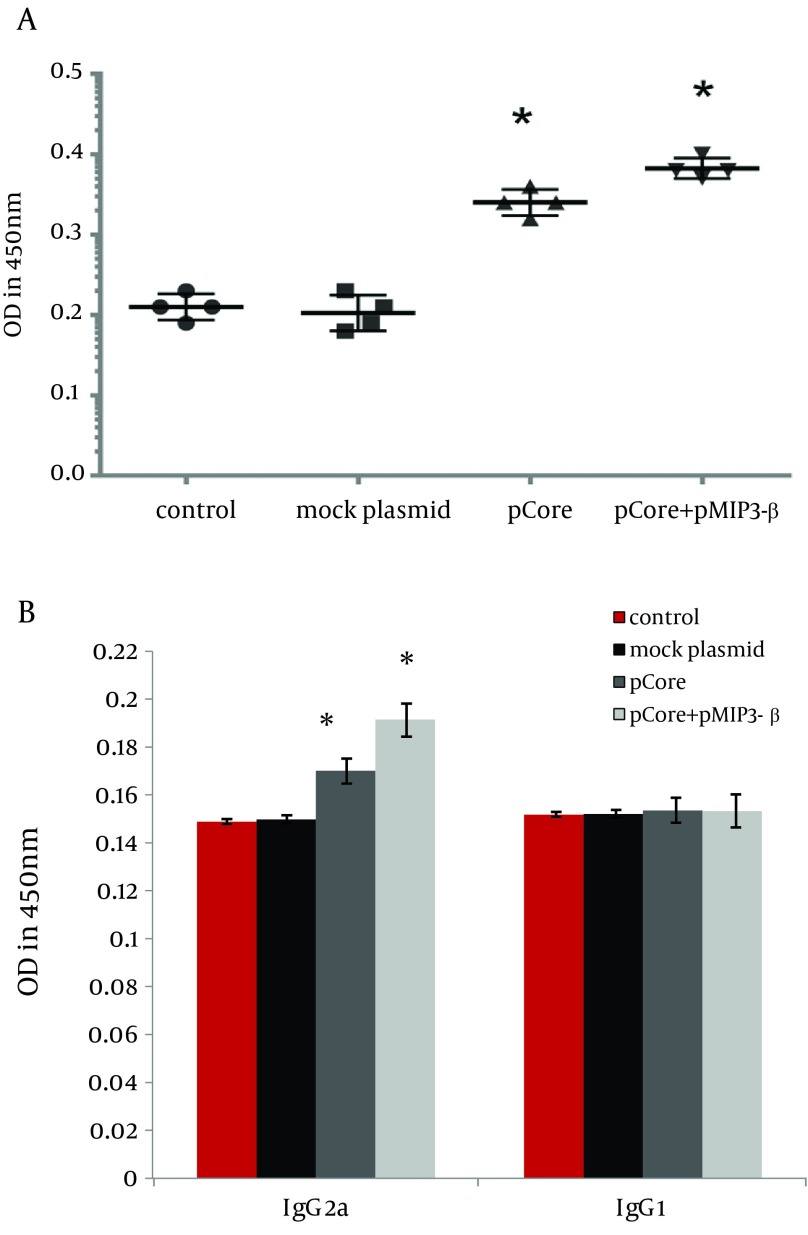
Figure 5. Determination of Core Specific Humoral Immune Responses.
ELISA was used to measure core specific total IgG (A), IgG1 and IgG2a subtypes levels (B). Data displays averages of OD absorbance at 450nm of four mice per group in duplicates ± SD. Asterisks indicate the groups showing statistically significant difference from each other and/or the control groups.

