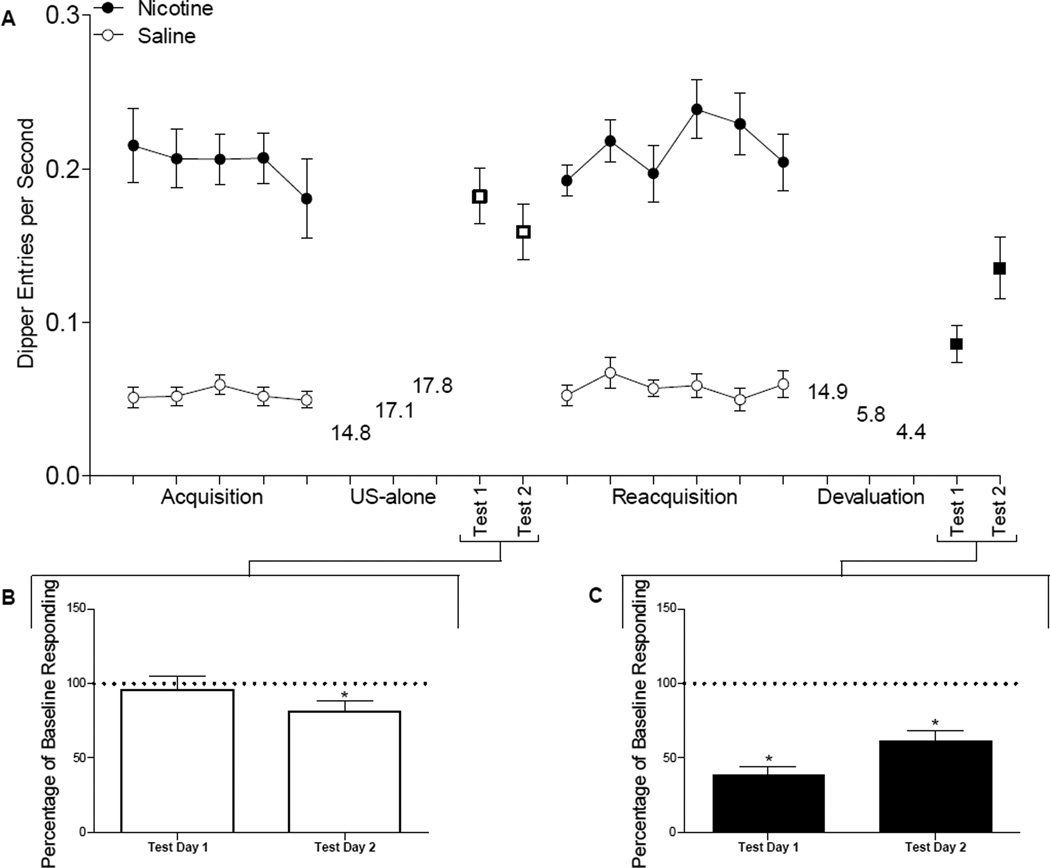
Figure 2.
Panel A shows dipper entries per second (±SEM) before the first sucrose delivery (nicotine sessions) or during a comparable time (saline sessions) for the last 5 nicotine and saline acquisition sessions, US-Alone test days (nicotine sessions only), reacquisition, and devaluation test days (nicotine sessions only). Sucrose consumption (ml) during US-alone and devaluation training is also reported on Panel A. Panel B shows the percentage of baseline responding (±SEM) on the test days following US-alone training. * denotes significant differences (p<o.05) from baseline (100%; dotted line). Panel C shows the percentage of baseline responding (±SEM) on the test days following devaluation training. * denotes significant differences (p<o.05) from baseline (100%; dotted line).

