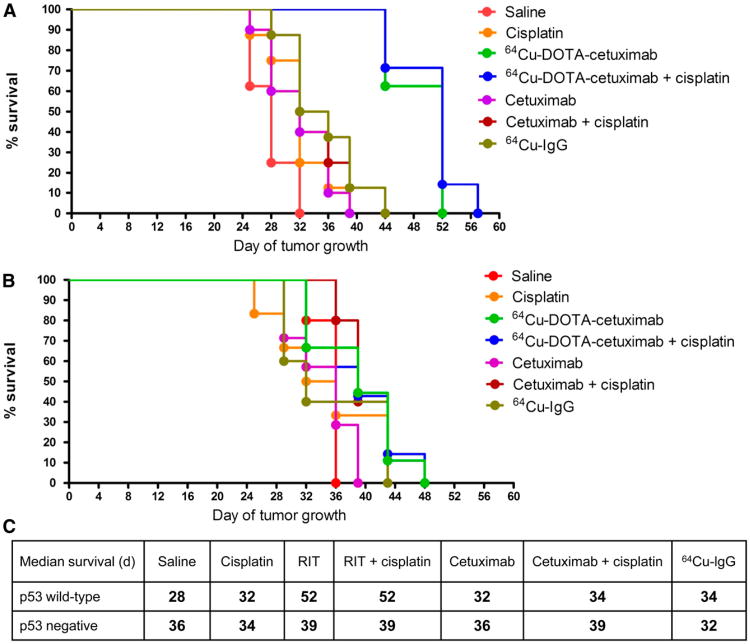
Figure 5.
Effect of p53 status in p53 wild-type (A) and p53-null (B) tumors on survival of HCT116 tumor–bearing nude mice in treated and control groups. Estimated survival distribution function was generated using Kaplan–Meier time-to-death analysis. Median survivals of all treated and control groups with HCT116 +/+ and HCT116 −/− tumors are summarized in C. ***P < 0.001 vs. radioimmunotherapy group. **P < 0.01 vs. radioimmunotherapy group. RIT = radioimmunotherapy.

