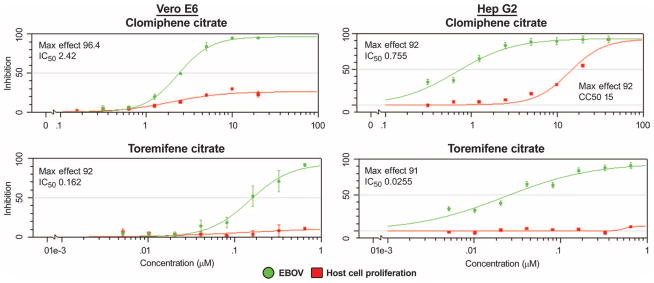
Fig. 1. In vitro eight-point dose-response curves for clomiphene and toremifene.

Compounds were evaluated in both the Vero E6 and HepG2 cell lines. The percent inhibition of the compound in the EBOV assay is shown in green, and the cytotoxic effect of the compounds on the host cell is shown in red. The maximum percent inhibition observed (Max Effect) and IC50 are indicated. Error bars indicate SEM. Results are from two replicates.
