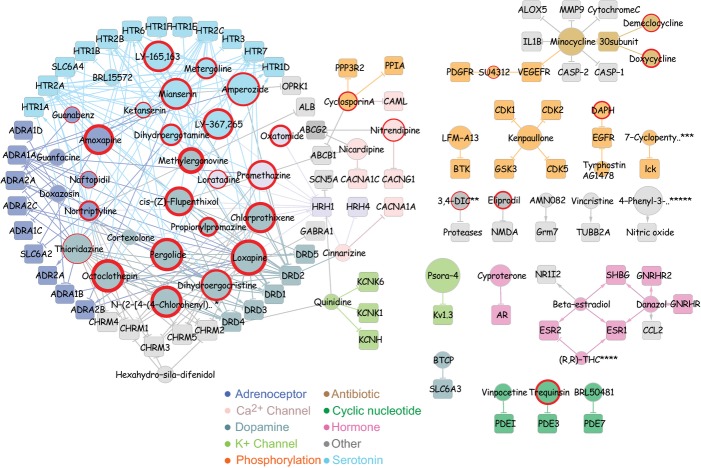
Figure 5.
Pharmacological network for lifespan extension. Shown is a network generated by connecting compounds (circles) and their respective protein targets (squares). Arrows indicate agonist action, and T’s indicate antagonist action. For compounds (circles), the node size is proportional to the compound’s effect on lifespan whereas the size of protein nodes is fixed. Induction of stress resistance is indicated by a red ring around compounds, with the thickness of the ring proportional to the effect magnitude. Nodes (compounds and targets) and connections between nodes are colored according to pharmacology, as indicated in the key below. See the Fig. 3 legend for names of compounds that are abbreviated.

