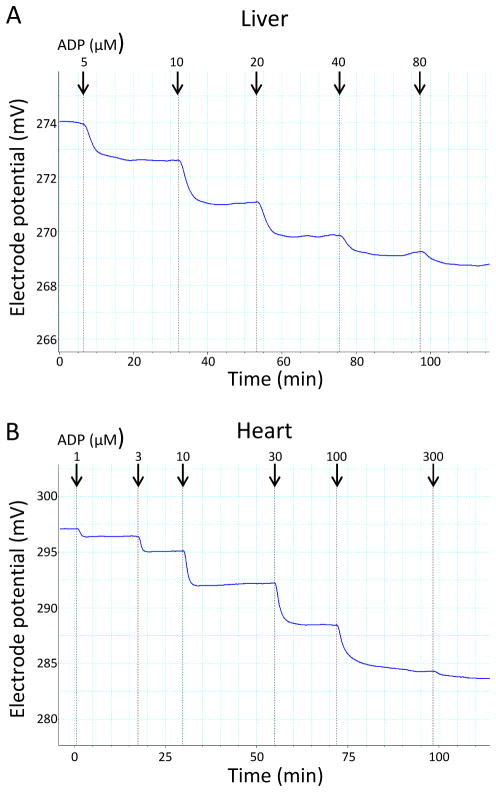
Figure 1.
Representative computer tracings of inner membrane potential vs. time obtained by incubating normal mouse liver mitochondria, 0.5 mg/ml, (panel A) or heart mitochondria, 0.25 mg/ml, (panel B) fueled by the combined substrates, 5 mM succinate + 5 mM glutamate + 1 mM malate. ADP was added in incremental amounts to generate the final total recycling nucleotide phosphate concentrations (indicated by arrows). After each addition, a plateau potential was reached, consistent with recycling at a steady ADP concentration and generation of a stepwise transition from state 4 to state 3 respiration. Note that the potential shown on the y-axis represents electrode potential (not mitochondrial potential). The actual ΔΨ follows a similar pattern after calculation using the Nernst equation based on the distribution of tetraphenylphosphonium (TPP) external and internal to mitochondria.

