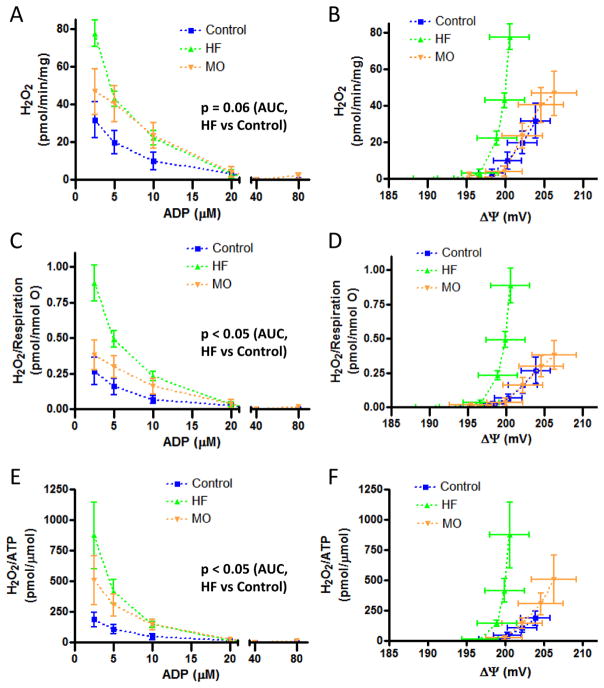
Figure 6.
H2O2 production by liver mitochondria of protocol II control, HF-fed, or MO-fed mice. A and B) Absolute values for H2O2 production as a function of ADP added to the medium (panel A) and resultant clamped ΔΨ (panel B). C and D) H2O2 production expressed per unit respiration as a function of added ADP (panel C) and resultant clamped ΔΨ (panel D). E and F) H2O2 production expressed per unit ATP generated as a function of added ADP (panel E) and resultant clamped ΔΨ (panel F). p values shown in panels A, C, and E represent the level of significance of differences in comparative values for area under the curve (AUC) by t-test with Bonferroni correction for multiple comparisons. Values at zero added ADP (near state 4 condition) are not shown since H2O2 production was 2–4 fold higher than at the lowest added ADP accounting for most of the AUC and obscuring the differences in the presence of added ADP (p-values did remain significant if the data at zero added ADP are included). “mg” in y-axis (panels A, B) refers to mg mitochondrial protein.

