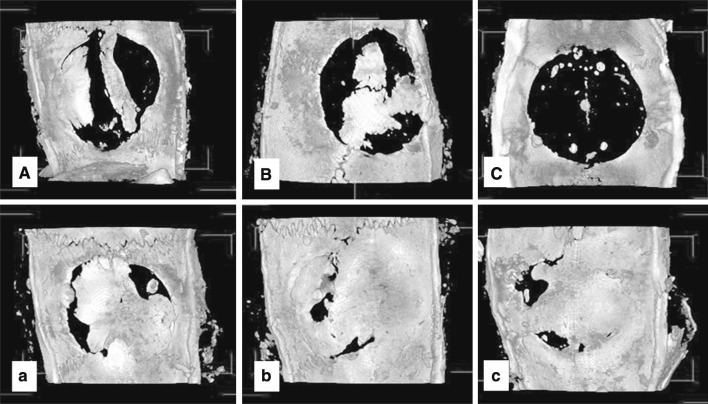
Fig. 4.
Representative images of maximum intensity projections of rat cranial defects obtained by micro CT at 12 weeks post-operatively. Group (A), (B) and (C) represents cranial defects implanted with 0, 50 and 90 wt% MCP gelatin sponges, without BMP-2, respectively. Group (a), (b) and (c), represents cranial defects implanted with 0, 50 and 90 wt% MCP gelatin sponges containing BMP-2, respectively

