Fig. 2.
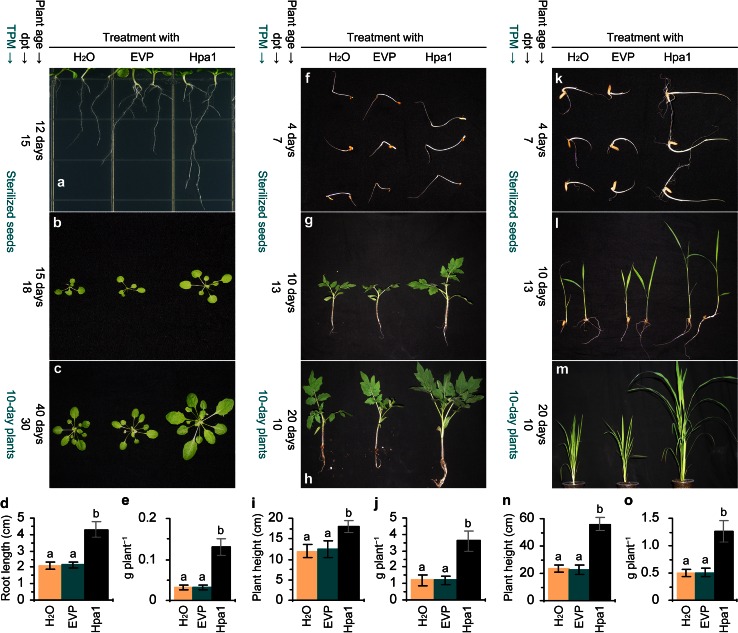
Hpa1-induced growth enhancement of Arabidopsis (a–e), tomato (f–h), and rice (k–m). Pure water and aqueous EVP and Hpa1 solutions were used separately to treat seeds by immersion or treat plants by spraying over plant tops. “TPM” refers to treated plant material, either sterilized seeds or 10-day-old seedlings; “dpt” denotes days posttreatment; “plant age” is the count of days after seed germination. Results shown in every treatment and plant species combination represent four experimental repeats and a total of 80 plants (20 plants per repeat). a Arabidopsis seedlings photographed at day 15 after treated seeds were inoculated on the medium. b Arabidopsis seedlings photographed at day 18 after treated seeds were inoculated on the potting soil. c Forty-day-old Arabidopsis plants from pots and photographed at day 30 after treatment. d Root length of Arabidopsis seedlings from a. e Fresh weight of Arabidopsis plants from d. Quantitative data shown in bar graphs are mean values ± standard deviation (SD) bars. f, k Tomato (f) and rice (k) seedlings photographed at day 7 after treated seeds were incubated on wet filter papers. g, l Tomato (g) and rice (l) seedlings photographed at day 13 after treated seeds were incubated in potting soil. i, j, n, o Biomass of tomato (i, j) from h and rice (n, o) from m. Data shown in bar graphs (bottom panels) are mean values ± standard deviation bars, and different letters on SD bars indicate significant differences analyzed by two-tailed ANOVA and Fisher’s least significant difference (LSD) test (P < 0.01)

