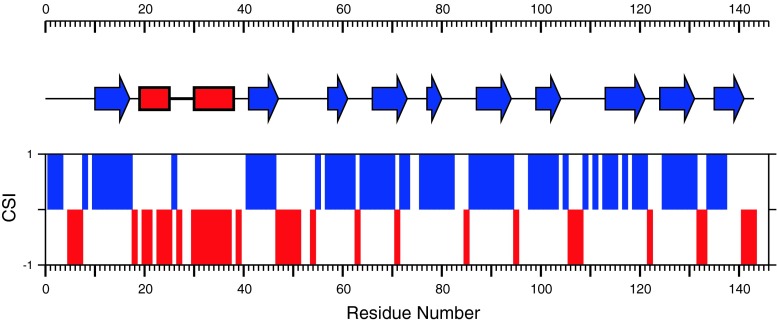
Fig. 2.
Alignment of CSI consensus values (bars) with the predicted secondary structure elements of As-p18. Positive and negative CSI values indicate β-strand and α-helix segments, respectively. The secondary structure prediction, was calculated using DANGLE for assigned Cα, Cβ, Hα, C’ and NH. Blue arrows and red rectangles represent β-strands and α-helical stretches, respectively

