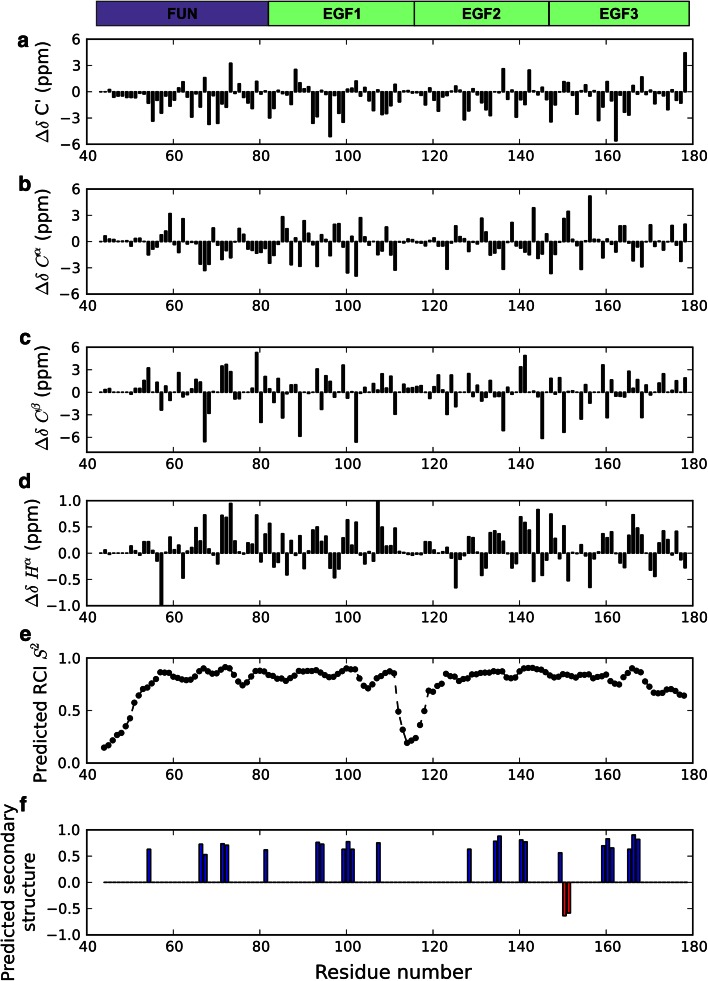
Fig. 3.
Analysis of FUN-EGF3 chemical shifts. Domains, defined by exon boundaries in the FBN1 gene (Pereira et al. 1993), are indicated by coloured boxes above the plots. a 13C′ secondary chemical shifts plotted as a function of residue number. b 13Cα secondary chemical shifts. c 13Cβ secondary chemical shifts d 1Hα secondary chemical shifts. e Random coil index (RCI) order parameters (S 2) predicted from chemical shifts, plotted as a function of residue number. Predictions were made using the TALOS+ and MICS servers (Shen et al. 2009, Shen and Bax 2012), using the method of Berjanskii and Wishart (2005). f Secondary structure prediction by TALOS+/MICS. Bars indicate the predicted secondary structure adopted by each residue, with the height showing the prediction probability. Positive values and blue bars indicate extended (β-strand) structure, while negative values and red bars indicate helical (α-helix) structure. Residues without bars are predicted to occur in loops, turns or regions with random-coil structure

