Figure 1.

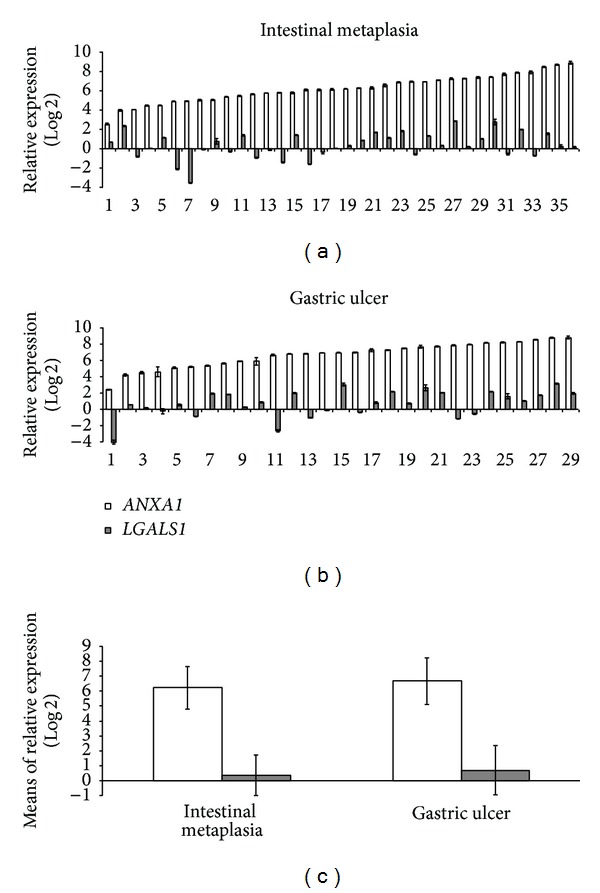
Distribution of relative gene expression (Log2RQ) of ANXA1 and LGALS1 (a and b) and mean values of relative gene expression in intestinal metaplasia and gastric ulcer groups (c).

Distribution of relative gene expression (Log2RQ) of ANXA1 and LGALS1 (a and b) and mean values of relative gene expression in intestinal metaplasia and gastric ulcer groups (c).