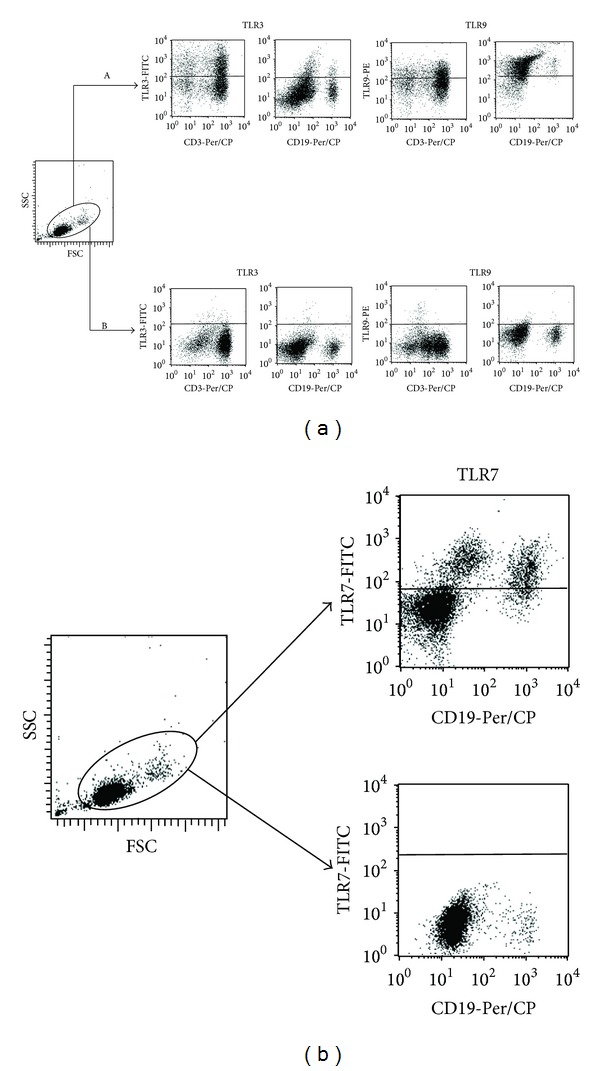
Figure 1.

(a) Representative dot plots from flow cytometry measurements of TLR3 and TLR9 expression on T- and B-cells in patients (panel A) and healthy controls (panel B). (b) Representative dot plots from flow cytometry measurements of TLR7 expression on B-cells in patients (upper right dot plot) and healthy controls (lower right dot plot).
