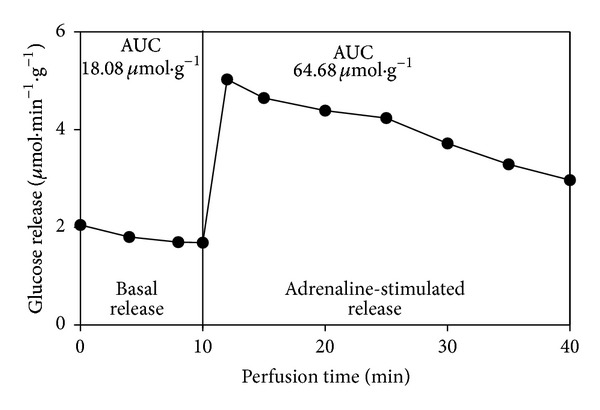
Figure 1.

Illustrative graph of liver glucose release in a fed control rat, before (basal release) and during (stimulated release) perfusion with adrenaline (1 μM). The vertical line indicates the transition from basal perfusion (KH only) to stimulated perfusion (KH with adrenaline 1 μM). The AUC of basal glucose release considered all glucose released during the 10-min interval. AUC of stimulated release considered those glucose values above the basal release during the 30-min interval.
