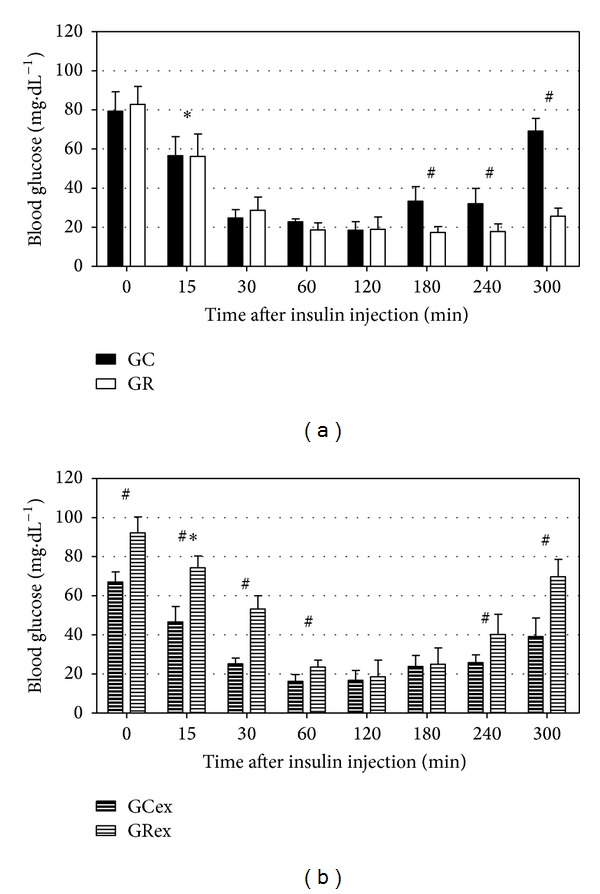
Figure 2.

Blood glucose profiles of control and food-restricted rats during insulin-induced hypoglycaemia, either without exercise ((a), groups GC and GR) or after an acute exercise session ((b), groups GCex and GRex). Insulin was i.p. injected at time 0 min and blood glucose was recorded for 300 min. Mean ± SD of 6–12 observations at each time. *P < 0.01 compared with time 0 min of the same group; # P < 0.01 between groups at the same time, according to Student's t-test.
