
Figure 1.
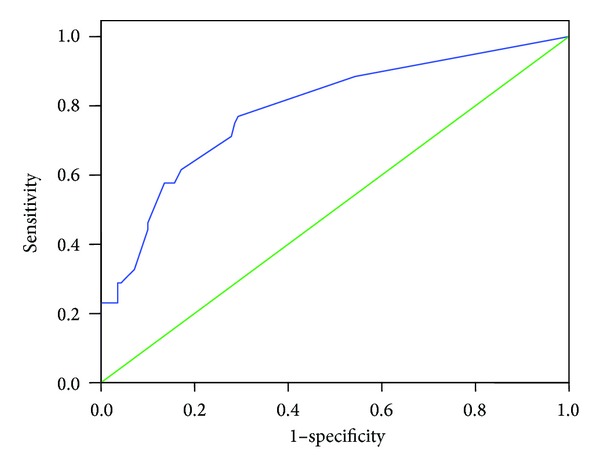
Analysis using the ROC curve showed that the area under the curve using SNAP II scores for Group 1 was 0.78 (CI 95% 0.71– 0.86).
Official websites use .gov
A
.gov website belongs to an official
government organization in the United States.
Secure .gov websites use HTTPS
A lock (
) or https:// means you've safely
connected to the .gov website. Share sensitive
information only on official, secure websites.
Analysis using the ROC curve showed that the area under the curve using SNAP II scores for Group 1 was 0.78 (CI 95% 0.71– 0.86).