
Figure 1.
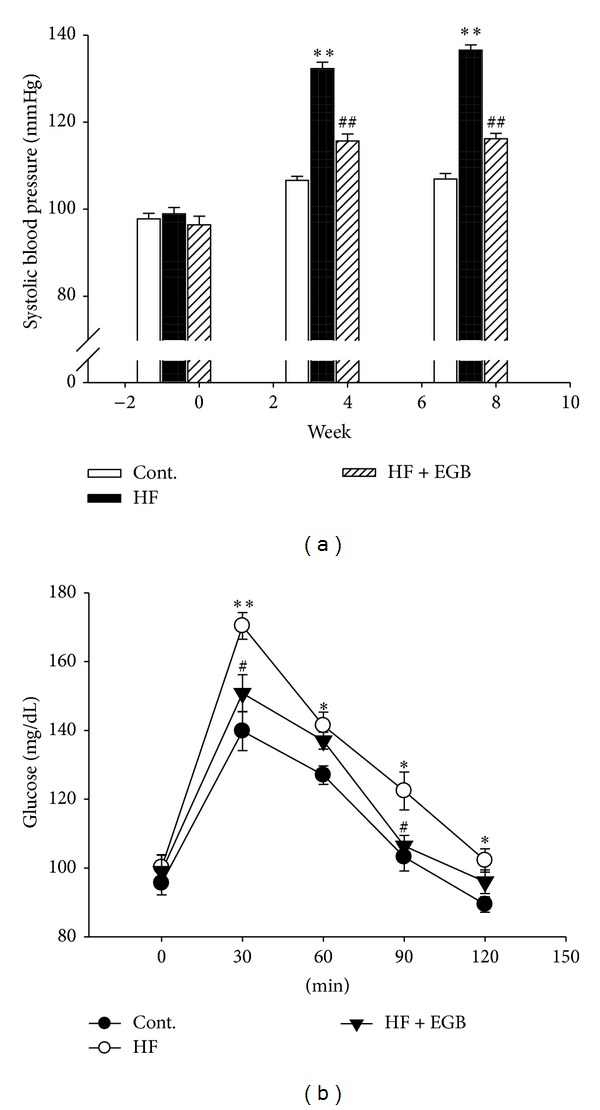
Effects of EGB on systolic blood pressure (a) and oral glucose tolerance test (b). Values were expressed as mean ± SE (n = 10). *P < 0.05, **P < 0.01 versus Cont.; # P < 0.05, ## P < 0.01 versus HF.
Official websites use .gov
A
.gov website belongs to an official
government organization in the United States.
Secure .gov websites use HTTPS
A lock (
) or https:// means you've safely
connected to the .gov website. Share sensitive
information only on official, secure websites.
Effects of EGB on systolic blood pressure (a) and oral glucose tolerance test (b). Values were expressed as mean ± SE (n = 10). *P < 0.05, **P < 0.01 versus Cont.; # P < 0.05, ## P < 0.01 versus HF.