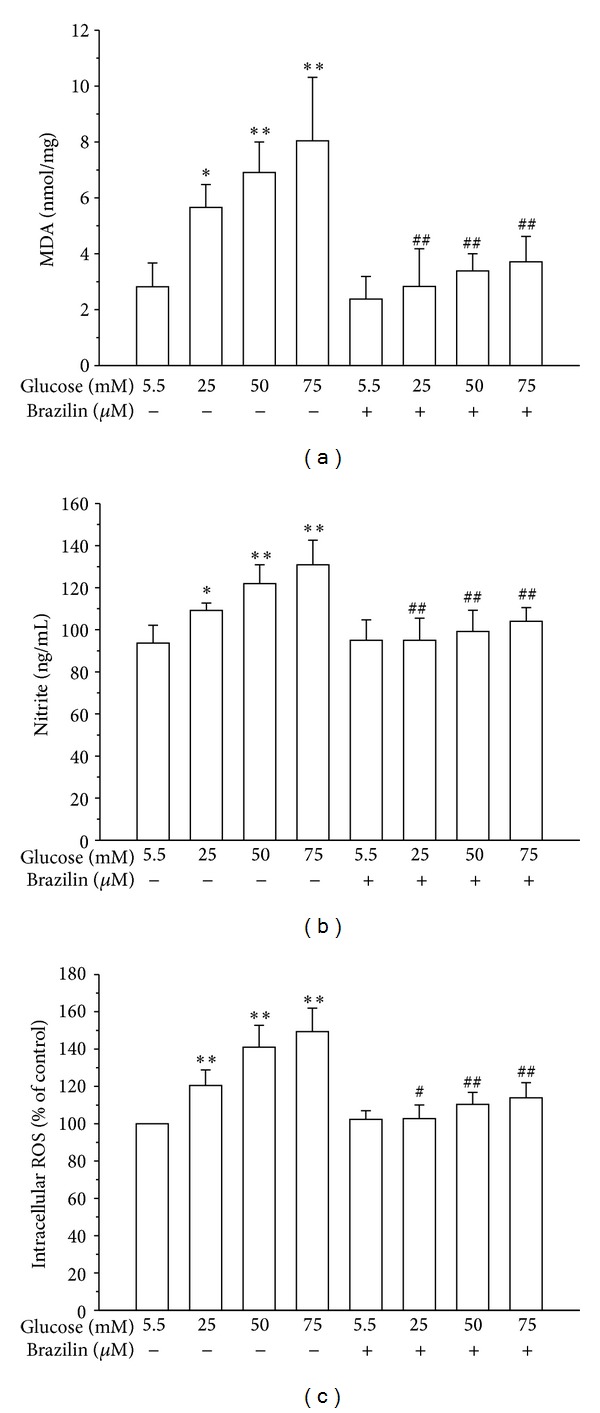
Figure 3.

Effects of brazilin on glucose-induced LPO, NO, and ROS production in HUVECs: (a) lipid peroxidation was assayed by measuring the amount of TBARS formation (malondialdehyde, MDA); (b) the nitrite concentration in the culture medium was determined by Griess reagent. (c) ROS production was determined as described in Materials and Methods. Data are shown as the mean ± SEM of three independent experiments. *P < 0.05 and **P < 0.01, compared to the glucose treated group; # P < 0.05 and ## P < 0.01, compared to the brazilin treated group.
