. 2014 Feb 26;2014:308306. doi: 10.1155/2014/308306
Copyright © 2014 Adnan Haider et al.
This is an open access article distributed under the Creative Commons Attribution License, which permits unrestricted use, distribution, and reproduction in any medium, provided the original work is properly cited.
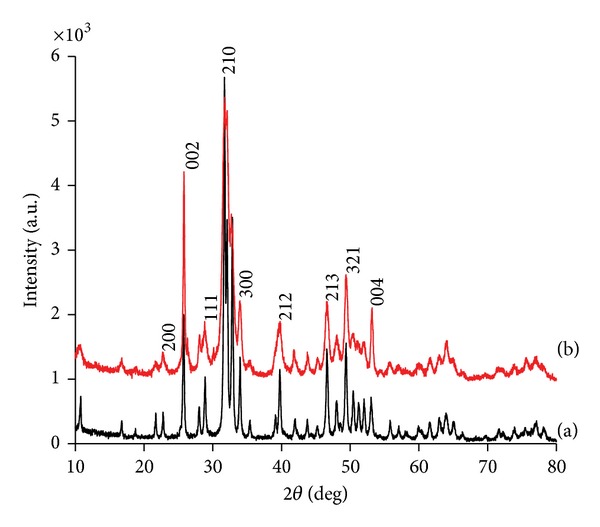
Figure 5.

XRD profiles of the (a) sHA and (b) nHA.
