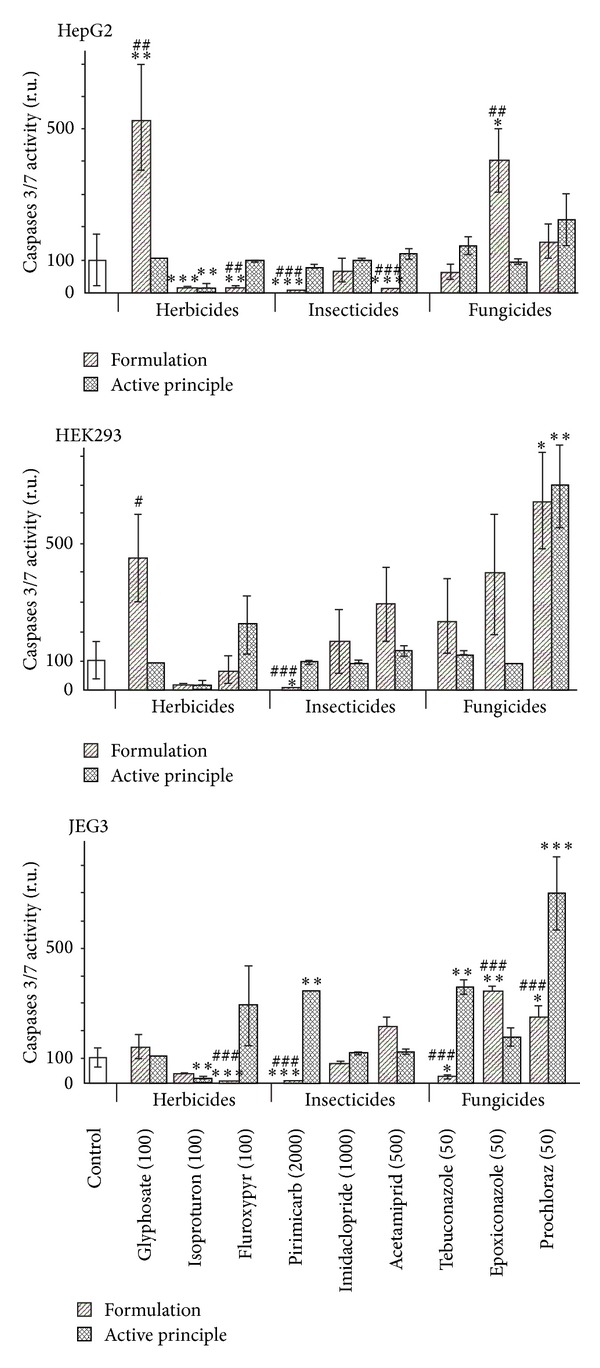
Figure 5.

Differential apoptotic effects between formulations and their APs. The three described human cell lines were used in the culture conditions of Figure 1. We have chosen the doses at the first differential effects measured by MTT assay. SEMs are shown in all instances (n = 9). For the comparison of each AP or formulation to the control (white column), *P < 0.05, **P < 0.01, and ***P < 0.001 in a nonparametric Mann-Whitney test. # symbol is used similarly for comparisons between APs and their formulations.
